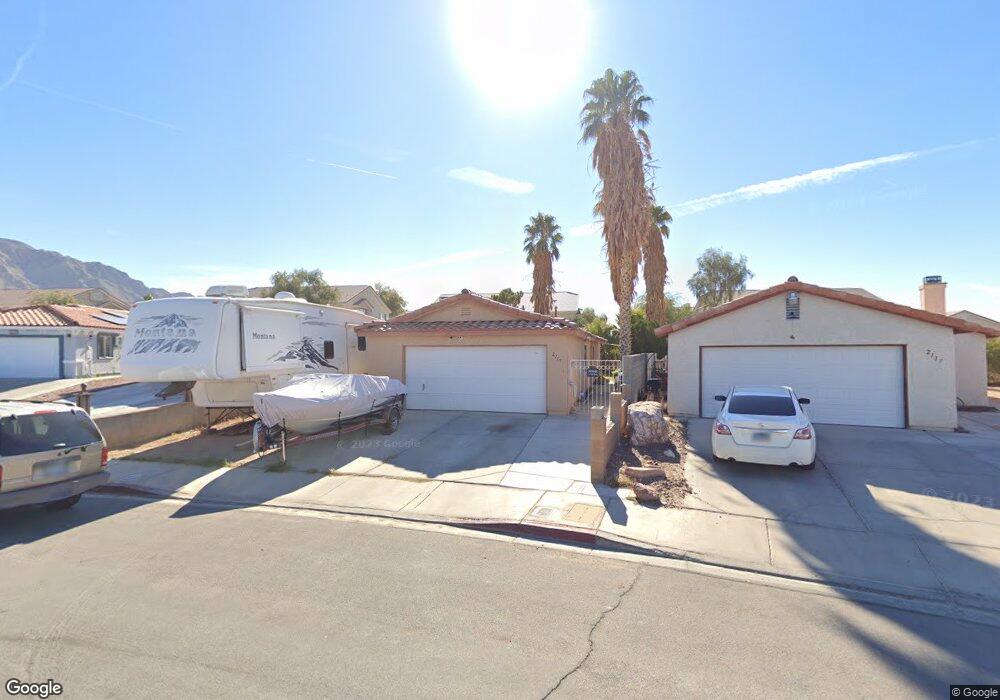
2088 Overton Beach St Unit 102 Las Vegas, NV 89156
Estimated Value: $272,000 - $303,000
3
Beds
3
Baths
1,468
Sq Ft
$197/Sq Ft
Est. Value
About This Home
This home is located at 2088 Overton Beach St Unit 102, Las Vegas, NV 89156 and is currently estimated at $289,310, approximately $197 per square foot. 2088 Overton Beach St Unit 102 is a home located in Clark County with nearby schools including Helen Herr Elementary School, Dr. William H. Bailey Middle School, and Sunrise Mountain High School.
Ownership History
Date
Name
Owned For
Owner Type
Purchase Details
Closed on
Feb 24, 2020
Sold by
Ghatas Naier and Hanna Rania M
Bought by
Ghatas Naier and Hanna Rania M
Current Estimated Value
Home Financials for this Owner
Home Financials are based on the most recent Mortgage that was taken out on this home.
Original Mortgage
$147,000
Outstanding Balance
$130,435
Interest Rate
3.6%
Mortgage Type
New Conventional
Estimated Equity
$158,875
Purchase Details
Closed on
Dec 17, 2018
Sold by
Ghatas Naier
Bought by
Ghatas Naier and Hanna Raina M Thabet
Purchase Details
Closed on
Oct 5, 2009
Sold by
D R Horton Inc
Bought by
Ghatas Naier
Home Financials for this Owner
Home Financials are based on the most recent Mortgage that was taken out on this home.
Original Mortgage
$100,152
Interest Rate
4.91%
Mortgage Type
FHA
Create a Home Valuation Report for This Property
The Home Valuation Report is an in-depth analysis detailing your home's value as well as a comparison with similar homes in the area
Home Values in the Area
Average Home Value in this Area
Purchase History
| Date | Buyer | Sale Price | Title Company |
|---|---|---|---|
| Ghatas Naier | -- | First American Title | |
| Ghatas Naier | -- | First American Title | |
| Ghatas Naier | $102,968 | Dhi Title Of Nevada |
Source: Public Records
Mortgage History
| Date | Status | Borrower | Loan Amount |
|---|---|---|---|
| Open | Ghatas Naier | $147,000 | |
| Previous Owner | Ghatas Naier | $100,152 |
Source: Public Records
Tax History Compared to Growth
Tax History
| Year | Tax Paid | Tax Assessment Tax Assessment Total Assessment is a certain percentage of the fair market value that is determined by local assessors to be the total taxable value of land and additions on the property. | Land | Improvement |
|---|---|---|---|---|
| 2025 | $1,066 | $83,260 | $19,950 | $63,310 |
| 2024 | $988 | $83,260 | $19,950 | $63,310 |
| 2023 | $658 | $79,255 | $21,700 | $57,555 |
| 2022 | $915 | $70,460 | $16,100 | $54,360 |
| 2021 | $850 | $58,466 | $14,000 | $44,466 |
| 2020 | $784 | $62,209 | $16,100 | $46,109 |
| 2019 | $735 | $57,479 | $11,900 | $45,579 |
| 2018 | $701 | $45,140 | $9,800 | $35,340 |
| 2017 | $1,202 | $39,998 | $7,350 | $32,648 |
| 2016 | $658 | $36,338 | $6,650 | $29,688 |
| 2015 | $655 | $29,470 | $4,900 | $24,570 |
| 2014 | $636 | $20,071 | $3,500 | $16,571 |
Source: Public Records
Map
Nearby Homes
- 2087 Arivada Ferry Ct Unit 101
- 2093 Scanlon Ferry Ct Unit 103
- 6304 Mount Rainier Ave
- 6273 Mount Rainier Ave
- 6286 E Lake Mead Blvd
- 6412 Dallaswood Ln
- 1932 Spindrift Ct
- 6560 Bush Clover Ln
- 1905 Eskam St
- 2289 Black Bush Ln
- 6201 E Lake Mead Blvd Unit 151
- 6201 E Lake Mead Blvd Unit E218
- 6201 E Lake Mead Blvd Unit 210
- 6192 Glacier Ave
- 6255 Bryce Canyon Ave
- 6346 Gold Canyon Dr
- 2147 Bridle Wreath Ln
- 6081 Mount Mckinley Ave
- 6271 E Great Smoky Ave
- 6375 Horizon Ridge Ct
- 2088 Overton Beach St Unit 103
- 2088 Overton Beach St Unit 101
- 2089 Overton Beach St Unit 103
- 2089 Overton Beach St Unit 102
- 2089 Overton Beach St Unit 101
- 2074 Overton Beach St Unit 101
- 2074 Overton Beach St Unit 103
- 2074 Overton Beach St Unit 102
- 2075 Overton Beach St Unit 101
- 2075 Overton Beach St Unit 103
- 2075 Overton Beach St Unit 102
- 2115 Birch Leaf Cir
- 2111 Birch Leaf Cir
- 2117 Birch Leaf Cir
- 2117 Birch Leaf Cir Unit n/a
- 2060 Overton Beach St Unit 101
- 2060 Overton Beach St Unit 103
- 2060 Overton Beach St Unit 102
- 2087 Arivada Ferry Ct Unit 103
- 2087 Arivada Ferry Ct Unit 102