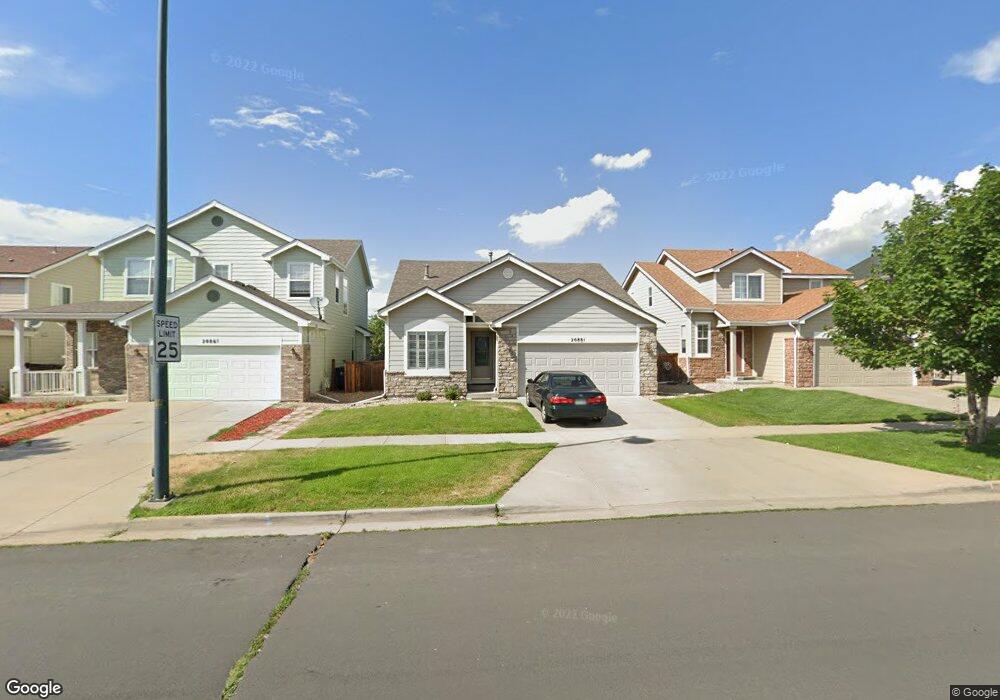
20881 E 40th Ave Denver, CO 80249
Green Valley Ranch NeighborhoodEstimated Value: $426,122 - $475,000
2
Beds
2
Baths
2,562
Sq Ft
$175/Sq Ft
Est. Value
About This Home
This home is located at 20881 E 40th Ave, Denver, CO 80249 and is currently estimated at $448,531, approximately $175 per square foot. 20881 E 40th Ave is a home located in Denver County with nearby schools including Green Valley Elementary School, Pitt-Waller K-8 School, and McGlone Academy.
Ownership History
Date
Name
Owned For
Owner Type
Purchase Details
Closed on
Sep 16, 2011
Sold by
Quick Kristene M and Quick Steven P
Bought by
Jones Beverly J
Current Estimated Value
Home Financials for this Owner
Home Financials are based on the most recent Mortgage that was taken out on this home.
Original Mortgage
$141,324
Outstanding Balance
$95,313
Interest Rate
4.25%
Mortgage Type
FHA
Estimated Equity
$353,218
Purchase Details
Closed on
Jun 28, 2005
Sold by
Collins Brian K and Collins Kimberly A
Bought by
Quick Kristene M and Quick Steven P
Home Financials for this Owner
Home Financials are based on the most recent Mortgage that was taken out on this home.
Original Mortgage
$145,600
Interest Rate
6.25%
Mortgage Type
Fannie Mae Freddie Mac
Purchase Details
Closed on
Feb 28, 2002
Sold by
Woodcrest Homes Inc
Bought by
Collins Brian K and Collins Kimberly A
Home Financials for this Owner
Home Financials are based on the most recent Mortgage that was taken out on this home.
Original Mortgage
$197,743
Interest Rate
6.81%
Mortgage Type
FHA
Create a Home Valuation Report for This Property
The Home Valuation Report is an in-depth analysis detailing your home's value as well as a comparison with similar homes in the area
Home Values in the Area
Average Home Value in this Area
Purchase History
| Date | Buyer | Sale Price | Title Company |
|---|---|---|---|
| Jones Beverly J | $145,000 | Fitco | |
| Quick Kristene M | $182,000 | Security Title | |
| Collins Brian K | $200,537 | Land Title |
Source: Public Records
Mortgage History
| Date | Status | Borrower | Loan Amount |
|---|---|---|---|
| Open | Jones Beverly J | $141,324 | |
| Previous Owner | Quick Kristene M | $145,600 | |
| Previous Owner | Collins Brian K | $197,743 |
Source: Public Records
Tax History
| Year | Tax Paid | Tax Assessment Tax Assessment Total Assessment is a certain percentage of the fair market value that is determined by local assessors to be the total taxable value of land and additions on the property. | Land | Improvement |
|---|---|---|---|---|
| 2025 | $2,942 | $37,970 | $4,120 | $4,120 |
| 2024 | $2,942 | $31,200 | $230 | $30,970 |
| 2023 | $2,792 | $31,200 | $230 | $30,970 |
| 2022 | $2,586 | $25,960 | $3,250 | $22,710 |
| 2021 | $2,529 | $26,700 | $3,340 | $23,360 |
| 2020 | $2,353 | $24,960 | $2,780 | $22,180 |
| 2019 | $2,302 | $24,960 | $2,780 | $22,180 |
| 2018 | $2,023 | $20,760 | $2,240 | $18,520 |
| 2017 | $2,018 | $20,760 | $2,240 | $18,520 |
| 2016 | $1,698 | $16,710 | $2,173 | $14,537 |
| 2015 | $1,545 | $15,730 | $2,173 | $13,557 |
| 2014 | $1,234 | $11,960 | $2,388 | $9,572 |
Source: Public Records
Map
Nearby Homes
- 20604 E 38th Place
- 4029 Orleans St
- 3880 N Jebel St
- 4312 Kirk Ct
- 21535 E 39th Ave
- 4087 Orleans Ct
- 4116 Orleans St
- 4125 Orleans Ct
- 4250 Perth Cir
- 3875 Perth St
- 21480 E 42nd Ave
- 4315 Orleans St
- 20420 Kelly Place
- 4192 Ireland Ct
- 20927 Kelly Place
- 4201 Ireland St
- 4381 Perth Cir
- 20762 E 44th Ave
- 20000 E Mitchell Place Unit 71
- 20000 Mitchell Place Unit 9
- 20891 E 40th Ave
- 20892 E 40th Place
- 20901 E 40th Ave
- 20851 E 40th Ave
- 20902 E 40th Place
- 20882 E 40th Place
- 20922 E 40th Place
- 20841 E 40th Ave
- 20921 E 40th Ave
- 20942 E 40th Place
- 20860 E 40th Ave
- 20840 E 40th Ave
- 20872 E 40th Place
- 20880 E 40th Ave
- 20821 E 40th Ave
- 20820 E 40th Ave
- 20941 E 40th Ave
- 20900 E 40th Ave
- 20952 E 40th Place
- 20810 E 40th Ave
Your Personal Tour Guide
Ask me questions while you tour the home.