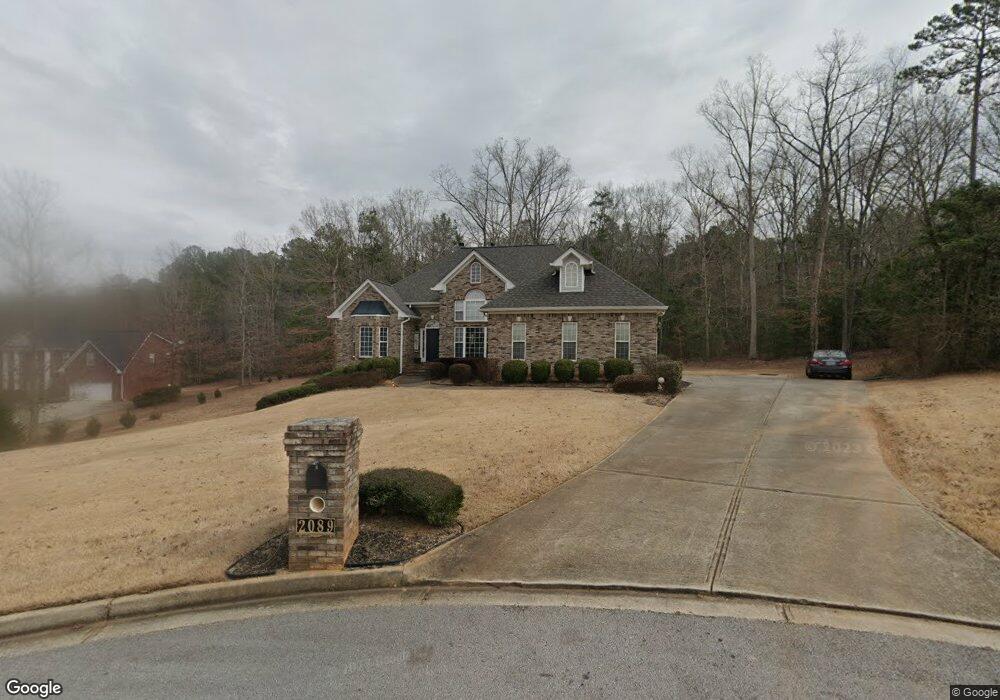
2089 Millstone Dr SW Conyers, GA 30094
Estimated Value: $397,000 - $487,000
3
Beds
2
Baths
2,629
Sq Ft
$168/Sq Ft
Est. Value
About This Home
This home is located at 2089 Millstone Dr SW, Conyers, GA 30094 and is currently estimated at $441,750, approximately $168 per square foot. 2089 Millstone Dr SW is a home located in Rockdale County with nearby schools including Lorraine Elementary School, Gen. Ray Davis Middle School, and Heritage High School.
Ownership History
Date
Name
Owned For
Owner Type
Purchase Details
Closed on
Jul 25, 2005
Sold by
Federal Home Loan Mortgage Corporation
Bought by
Johnson Sheila M
Current Estimated Value
Home Financials for this Owner
Home Financials are based on the most recent Mortgage that was taken out on this home.
Original Mortgage
$251,800
Outstanding Balance
$130,740
Interest Rate
5.48%
Mortgage Type
New Conventional
Estimated Equity
$311,010
Purchase Details
Closed on
Apr 5, 2005
Sold by
Wells Fargo Bk
Bought by
Federal Home Loan Mortgage Corporation
Purchase Details
Closed on
Sep 30, 2002
Sold by
Homes By Janet Llc
Bought by
Smalls Thomas and Smalls Victoria
Home Financials for this Owner
Home Financials are based on the most recent Mortgage that was taken out on this home.
Original Mortgage
$203,291
Interest Rate
5.38%
Mortgage Type
New Conventional
Create a Home Valuation Report for This Property
The Home Valuation Report is an in-depth analysis detailing your home's value as well as a comparison with similar homes in the area
Home Values in the Area
Average Home Value in this Area
Purchase History
| Date | Buyer | Sale Price | Title Company |
|---|---|---|---|
| Johnson Sheila M | -- | -- | |
| Federal Home Loan Mortgage Corporation | -- | -- | |
| Wells Fargo Bk | $203,726 | -- | |
| Smalls Thomas | $254,200 | -- |
Source: Public Records
Mortgage History
| Date | Status | Borrower | Loan Amount |
|---|---|---|---|
| Open | Johnson Sheila M | $251,800 | |
| Previous Owner | Smalls Thomas | $203,291 |
Source: Public Records
Tax History Compared to Growth
Tax History
| Year | Tax Paid | Tax Assessment Tax Assessment Total Assessment is a certain percentage of the fair market value that is determined by local assessors to be the total taxable value of land and additions on the property. | Land | Improvement |
|---|---|---|---|---|
| 2024 | $4,421 | $175,440 | $28,000 | $147,440 |
| 2023 | $3,997 | $164,560 | $30,120 | $134,440 |
| 2022 | $3,150 | $131,600 | $28,000 | $103,600 |
| 2021 | $2,852 | $112,640 | $21,200 | $91,440 |
| 2020 | $2,795 | $106,720 | $21,000 | $85,720 |
| 2019 | $2,569 | $97,120 | $14,960 | $82,160 |
| 2018 | $2,271 | $86,960 | $11,960 | $75,000 |
| 2017 | $2,159 | $82,440 | $11,880 | $70,560 |
| 2016 | $1,996 | $82,440 | $11,880 | $70,560 |
| 2015 | $1,762 | $74,240 | $9,400 | $64,840 |
| 2014 | $1,577 | $74,240 | $9,400 | $64,840 |
| 2013 | -- | $90,960 | $20,000 | $70,960 |
Source: Public Records
Map
Nearby Homes
- 3238 Ashmore Ct
- 3320 Westborough Ln
- 3412 Deer Trace SW
- 3181 Buck Branch Rd SW
- 2803 Tucker Mill Ct SW
- 3444 E Fairview Rd SW
- 2900 Orchard Rd SW
- 3511 Clear View Trail
- 3405 Monica Ln SW Unit 4
- 3405 Monica Ln SW
- 3310 & 3308 Bold Spring Dr
- 3310 Bold Spring Dr
- 0 SW St Lucia Sunrise Unit 10642865
- 00 Highway 138
- 3905 Highway 138
- --- Highway 138
- 3312 Mill Forest Dr SW
- 3294 Mill Forest Dr SW
- 3284 Creekside Dr SE
- 4103 Sierra Ct
- 2085 Millstone Dr SW
- 2093 Millstone Dr SW
- 2081 Millstone Dr SW
- 2084 Millstone Dr SW
- 2088 Millstone Dr SW
- 2092 Millstone Dr SW
- 2077 Millstone Dr SW
- 2080 Millstone Dr SW
- 3060 Tucker Mill Rd SW
- 3247 Ashmore Ct
- 2076 Millstone Dr SW
- 3247 SW Ashmore Ct 0
- 3247 SW Ashmore Court 0
- 3243 Ashmore Ct
- 3243 SW Ashmore Ct 0
- 3243 SW Ashmore Court 0
- 3251 Ashmore Ct
- 3251 SW Ashmore Ct 0
- 3251 SW Ashmore Court 0
- 3239 Ashmore Ct