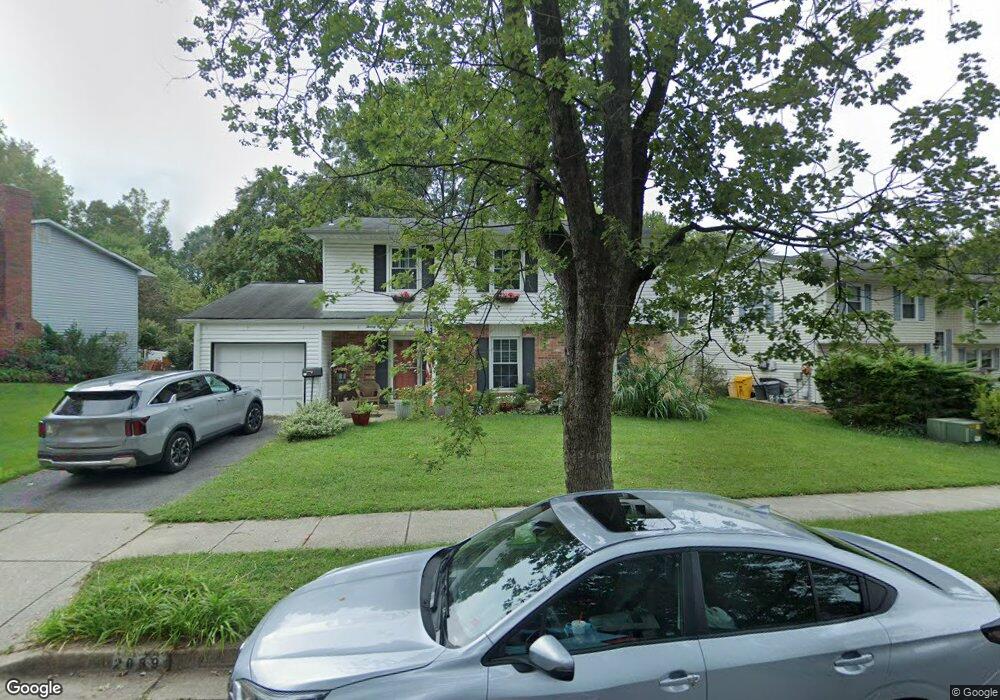
2089 Pear Hill Ct Crofton, MD 21114
Estimated Value: $548,000 - $710,000
4
Beds
3
Baths
1,870
Sq Ft
$331/Sq Ft
Est. Value
About This Home
This home is located at 2089 Pear Hill Ct, Crofton, MD 21114 and is currently estimated at $619,778, approximately $331 per square foot. 2089 Pear Hill Ct is a home located in Anne Arundel County with nearby schools including Crofton Meadows Elementary School, Crofton Middle School, and Crofton High School.
Ownership History
Date
Name
Owned For
Owner Type
Purchase Details
Closed on
Jun 20, 2011
Sold by
Wilson Slade B
Bought by
Kerner Paul and Kerner Patricia S
Current Estimated Value
Home Financials for this Owner
Home Financials are based on the most recent Mortgage that was taken out on this home.
Original Mortgage
$336,254
Outstanding Balance
$233,108
Interest Rate
4.75%
Mortgage Type
FHA
Estimated Equity
$386,670
Purchase Details
Closed on
May 24, 2011
Sold by
Wilson Slade B and Wilson Wendy L
Bought by
Kerner Paul and Kerner Patricia S
Home Financials for this Owner
Home Financials are based on the most recent Mortgage that was taken out on this home.
Original Mortgage
$336,254
Outstanding Balance
$233,108
Interest Rate
4.75%
Mortgage Type
FHA
Estimated Equity
$386,670
Purchase Details
Closed on
Jun 2, 2004
Sold by
Corcoran John P
Bought by
Wilson Slade B and Wilson Wendy L
Purchase Details
Closed on
May 7, 2004
Sold by
Corcoran John P
Bought by
Wilson Slade B and Wilson Wendy L
Create a Home Valuation Report for This Property
The Home Valuation Report is an in-depth analysis detailing your home's value as well as a comparison with similar homes in the area
Home Values in the Area
Average Home Value in this Area
Purchase History
| Date | Buyer | Sale Price | Title Company |
|---|---|---|---|
| Kerner Paul | $345,000 | -- | |
| Kerner Paul | $345,000 | Preferred Title & Escrow Inc | |
| Kerner Paul | $345,000 | -- | |
| Wilson Slade B | $327,500 | -- | |
| Wilson Slade B | $327,500 | -- |
Source: Public Records
Mortgage History
| Date | Status | Borrower | Loan Amount |
|---|---|---|---|
| Open | Kerner Paul | $336,254 | |
| Closed | Kerner Paul | $336,254 | |
| Closed | Wilson Slade B | -- |
Source: Public Records
Tax History Compared to Growth
Tax History
| Year | Tax Paid | Tax Assessment Tax Assessment Total Assessment is a certain percentage of the fair market value that is determined by local assessors to be the total taxable value of land and additions on the property. | Land | Improvement |
|---|---|---|---|---|
| 2025 | $4,697 | $470,933 | -- | -- |
| 2024 | $4,697 | $436,667 | $0 | $0 |
| 2023 | $4,546 | $402,400 | $246,900 | $155,500 |
| 2022 | $4,254 | $396,233 | $0 | $0 |
| 2020 | $4,070 | $383,900 | $236,900 | $147,000 |
| 2019 | $4,009 | $383,900 | $236,900 | $147,000 |
| 2018 | $3,893 | $383,900 | $236,900 | $147,000 |
| 2017 | $3,792 | $386,900 | $0 | $0 |
| 2016 | -- | $361,000 | $0 | $0 |
| 2015 | -- | $335,100 | $0 | $0 |
| 2014 | -- | $309,200 | $0 | $0 |
Source: Public Records
Map
Nearby Homes
- 1928 Tilghman Dr
- 1816 Whites Ferry Place Unit 6
- 1681 Yorktown Ct
- 1648 New Windsor Ct
- 1635 Howard Chapel Ct
- 1822 Foxdale Ct
- 1745 Leisure Way
- 1851 Foxdale Ct
- 1717 Aberdeen Ct
- 2623 Salford Dr
- 1640 Grason Ln
- 1677 Hart Ct
- 1705 Hart Ct
- 1715 Hart Ct
- 2241 Aberdeen Dr
- 2508 Stow Ct
- 2173 Johns Hopkins Rd
- 1523 Eton Way
- 2447 Bolton Ln
- 1530 Falstone Ln
- 2091 Pear Hill Ct
- 2087 Pear Hill Ct
- 2093 Pear Hill Ct
- 2092 Montipelier Ct
- 2085 Pear Hill Ct
- 2094 Montipelier Ct
- 2090 Pear Hill Ct
- 2088 Pear Hill Ct
- 2086 Pear Hill Ct
- 1340 Crain Hwy
- 2092 Pear Hill Ct
- 2084 Pear Hill Ct
- 1727 Linkwood Ln
- 2095 Pear Hill Ct
- 2090 Montipelier Ct
- 2083 Pear Hill Ct
- 2094 Pear Hill Ct
- 2082 Pear Hill Ct
- 2096 Montipelier Ct
- 2089 Jason Ct