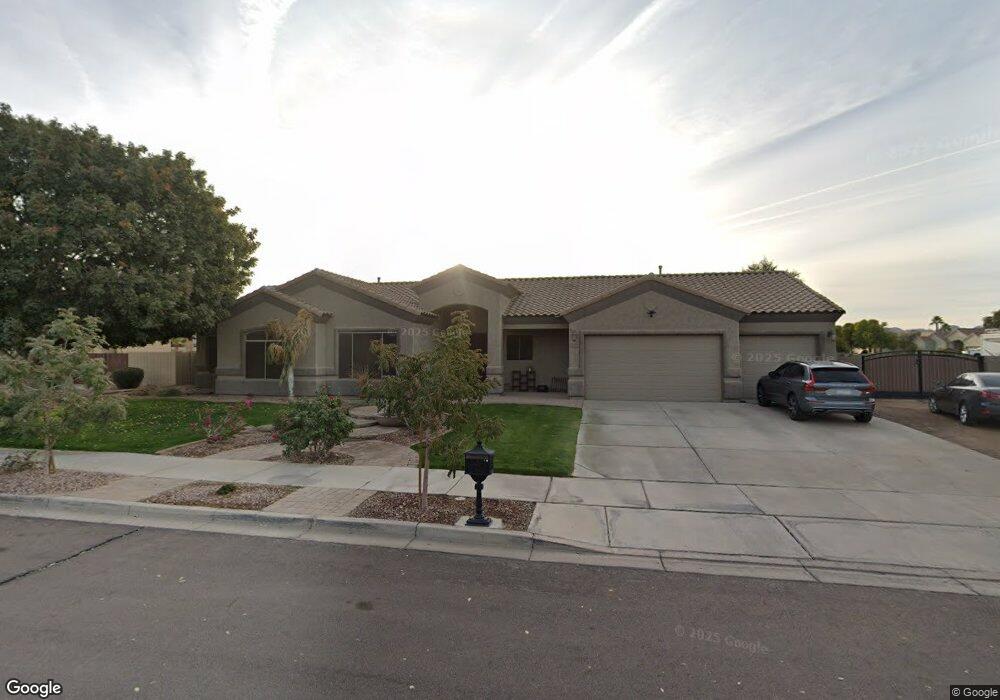
20895 S Claudius Rd Queen Creek, AZ 85142
Estimated Value: $650,962 - $710,000
--
Bed
3
Baths
2,114
Sq Ft
$325/Sq Ft
Est. Value
About This Home
This home is located at 20895 S Claudius Rd, Queen Creek, AZ 85142 and is currently estimated at $686,741, approximately $324 per square foot. 20895 S Claudius Rd is a home located in Maricopa County with nearby schools including Desert Mountain Elementary School, Queen Creek Junior High School, and American Leadership Academy, Queen Creek K-6.
Ownership History
Date
Name
Owned For
Owner Type
Purchase Details
Closed on
Mar 4, 2022
Sold by
Black Living Trust
Bought by
Christensen Duane Scott
Current Estimated Value
Home Financials for this Owner
Home Financials are based on the most recent Mortgage that was taken out on this home.
Original Mortgage
$414,000
Outstanding Balance
$386,106
Interest Rate
3.76%
Mortgage Type
New Conventional
Estimated Equity
$300,635
Purchase Details
Closed on
Apr 23, 2018
Sold by
Black Aaron and Black Lena
Bought by
Black Aaron and Black Lena
Purchase Details
Closed on
Jan 4, 2005
Sold by
A&B Investments Inc
Bought by
Black Aaron and Black Lena
Home Financials for this Owner
Home Financials are based on the most recent Mortgage that was taken out on this home.
Original Mortgage
$198,212
Interest Rate
5.7%
Mortgage Type
New Conventional
Create a Home Valuation Report for This Property
The Home Valuation Report is an in-depth analysis detailing your home's value as well as a comparison with similar homes in the area
Home Values in the Area
Average Home Value in this Area
Purchase History
| Date | Buyer | Sale Price | Title Company |
|---|---|---|---|
| Christensen Duane Scott | $690,000 | Arizona Premier Title | |
| Black Aaron | -- | None Available | |
| Black Aaron | $247,766 | Security Title Agency Inc |
Source: Public Records
Mortgage History
| Date | Status | Borrower | Loan Amount |
|---|---|---|---|
| Open | Christensen Duane Scott | $414,000 | |
| Previous Owner | Black Aaron | $198,212 | |
| Closed | Black Aaron | $37,165 |
Source: Public Records
Tax History Compared to Growth
Tax History
| Year | Tax Paid | Tax Assessment Tax Assessment Total Assessment is a certain percentage of the fair market value that is determined by local assessors to be the total taxable value of land and additions on the property. | Land | Improvement |
|---|---|---|---|---|
| 2025 | $2,507 | $28,898 | -- | -- |
| 2024 | $2,710 | $27,522 | -- | -- |
| 2023 | $2,710 | $54,670 | $10,930 | $43,740 |
| 2022 | $2,631 | $41,410 | $8,280 | $33,130 |
| 2021 | $2,687 | $36,320 | $7,260 | $29,060 |
| 2020 | $2,602 | $33,380 | $6,670 | $26,710 |
| 2019 | $2,562 | $28,300 | $5,660 | $22,640 |
| 2018 | $3,038 | $26,730 | $5,340 | $21,390 |
| 2017 | $3,026 | $25,430 | $5,080 | $20,350 |
| 2016 | $2,256 | $23,820 | $4,760 | $19,060 |
| 2015 | $2,348 | $22,470 | $4,490 | $17,980 |
Source: Public Records
Map
Nearby Homes
- 19943 E Augustus Ave
- 19699 E Apricot Ln
- 19943 E Strawberry Dr
- 19880 E Apricot Ln
- 19837 E Thornton Rd
- 19604 E Thornton Rd
- 19813 E Carriage Way
- 20258 S 196th St
- 19655 E Reins Rd
- 19279 E Peartree Ln
- 19677 E Canary Way
- 19319 E Thornton Rd
- 21640 S Hawes Rd
- 21915 S Reina Dr
- 19784 E Raven Dr
- 19801 E Ocotillo Rd Unit 19
- 22219 S 191st Way
- 19820 S Mesquite Dr
- 20252 E Quintero Rd
- 20198 E Rosa Rd
- 20873 S Claudius Rd
- 20896 S Titus St
- 20905 S Claudius Rd Unit 88
- 20880 S Titus St
- 20892 S Claudius Rd
- 20880 S Titus St
- 20866 S Claudius Rd
- 20851 S Claudius Rd
- 20902 S Claudius Rd
- 20902 S Claudius Rd Unit 136
- 20864 S Titus St
- 19712 E Augustus Ave
- 20927 S Claudius Rd
- 19701 E Augustus Ave
- 20893 S Titus Cir
- 20840 S Claudius Rd
- 20883 S Titus Cir
- 20924 S Claudius Rd Unit 135
- 20924 S Claudius Rd
- 20829 S Claudius Rd