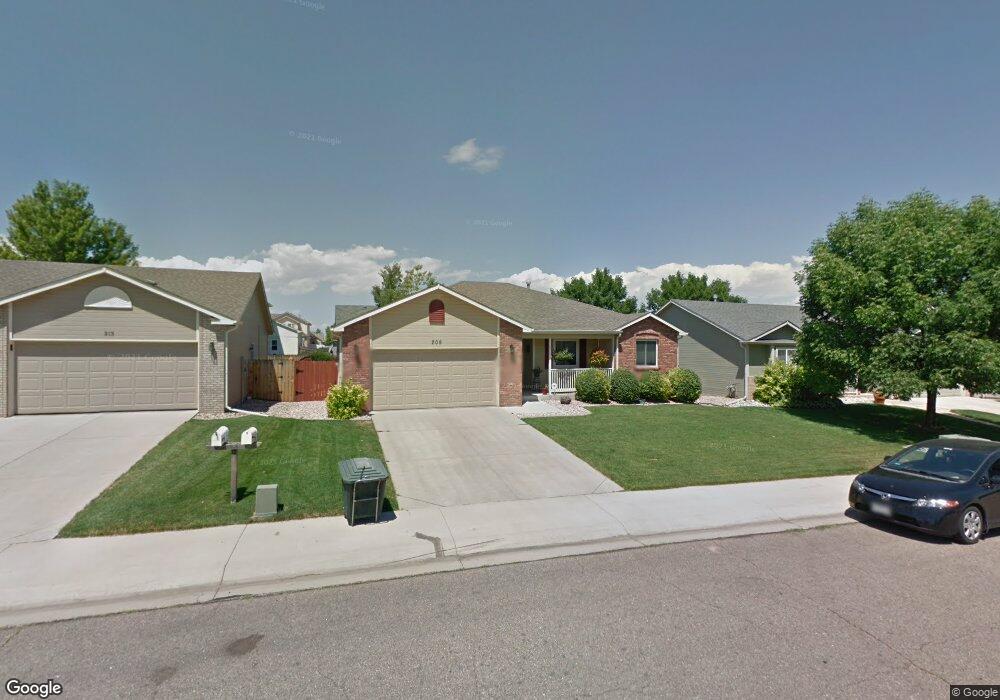
209 51st Ave Greeley, CO 80634
Kelly Farm NeighborhoodEstimated Value: $414,113 - $455,000
3
Beds
4
Baths
1,488
Sq Ft
$296/Sq Ft
Est. Value
About This Home
This home is located at 209 51st Ave, Greeley, CO 80634 and is currently estimated at $440,778, approximately $296 per square foot. 209 51st Ave is a home located in Weld County with nearby schools including S. Christa McAuliffe STEM Academy, Northridge High School, and Union Colony Preparatory School.
Ownership History
Date
Name
Owned For
Owner Type
Purchase Details
Closed on
Mar 16, 2011
Sold by
Thomas Jason Scott
Bought by
Thomas Stephanie A
Current Estimated Value
Home Financials for this Owner
Home Financials are based on the most recent Mortgage that was taken out on this home.
Original Mortgage
$154,000
Outstanding Balance
$107,051
Interest Rate
5.04%
Mortgage Type
New Conventional
Estimated Equity
$333,727
Purchase Details
Closed on
May 13, 2000
Sold by
Stigall Gregg T and Stigall Lori D
Bought by
Thomas Jason Scott and Thomas Stephanie A
Home Financials for this Owner
Home Financials are based on the most recent Mortgage that was taken out on this home.
Original Mortgage
$121,900
Interest Rate
8.66%
Mortgage Type
Balloon
Purchase Details
Closed on
Jan 29, 1999
Sold by
Wones Jerry A
Bought by
Stigall Gregg T and Stigall Lori D
Home Financials for this Owner
Home Financials are based on the most recent Mortgage that was taken out on this home.
Original Mortgage
$135,750
Interest Rate
6.79%
Create a Home Valuation Report for This Property
The Home Valuation Report is an in-depth analysis detailing your home's value as well as a comparison with similar homes in the area
Home Values in the Area
Average Home Value in this Area
Purchase History
| Date | Buyer | Sale Price | Title Company |
|---|---|---|---|
| Thomas Stephanie A | -- | None Available | |
| Thomas Jason Scott | $152,400 | Stewart Title | |
| Stigall Gregg T | $142,900 | -- |
Source: Public Records
Mortgage History
| Date | Status | Borrower | Loan Amount |
|---|---|---|---|
| Open | Thomas Stephanie A | $154,000 | |
| Previous Owner | Thomas Jason Scott | $121,900 | |
| Previous Owner | Stigall Gregg T | $135,750 |
Source: Public Records
Tax History
| Year | Tax Paid | Tax Assessment Tax Assessment Total Assessment is a certain percentage of the fair market value that is determined by local assessors to be the total taxable value of land and additions on the property. | Land | Improvement |
|---|---|---|---|---|
| 2025 | $2,009 | $25,730 | $5,310 | $20,420 |
| 2024 | $2,009 | $25,730 | $5,310 | $20,420 |
| 2023 | $1,916 | $27,520 | $4,600 | $22,920 |
| 2022 | $1,941 | $22,150 | $4,450 | $17,700 |
| 2021 | $2,002 | $22,790 | $4,580 | $18,210 |
| 2020 | $1,849 | $21,110 | $3,930 | $17,180 |
| 2019 | $1,854 | $21,110 | $3,930 | $17,180 |
| 2018 | $1,523 | $18,300 | $3,600 | $14,700 |
| 2017 | $1,532 | $18,300 | $3,600 | $14,700 |
| 2016 | $1,201 | $16,140 | $2,790 | $13,350 |
| 2015 | $1,197 | $16,140 | $2,790 | $13,350 |
| 2014 | $1,038 | $13,670 | $2,790 | $10,880 |
Source: Public Records
Map
Nearby Homes
Your Personal Tour Guide
Ask me questions while you tour the home.