Estimated Value: $94,000 - $127,000
3
Beds
2
Baths
1,680
Sq Ft
$69/Sq Ft
Est. Value
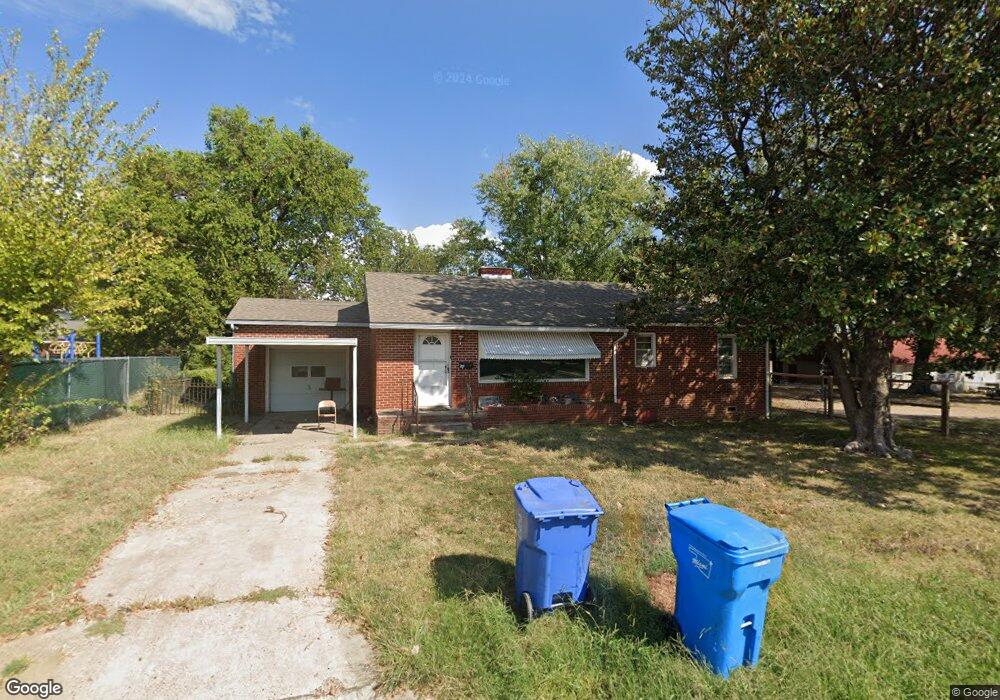
About This Home
This home is located at 209 B St SW, Miami, OK 74354 and is currently estimated at $115,526, approximately $68 per square foot. 209 B St SW is a home located in Ottawa County with nearby schools including Miami High School and Mt. Olive Lutheran School.
Ownership History
Date
Name
Owned For
Owner Type
Purchase Details
Closed on
Oct 31, 2008
Sold by
Mosler Jolene Sue and Gaier Ralph
Bought by
Phelan Angela J
Current Estimated Value
Home Financials for this Owner
Home Financials are based on the most recent Mortgage that was taken out on this home.
Original Mortgage
$69,088
Outstanding Balance
$45,163
Interest Rate
6.08%
Mortgage Type
FHA
Estimated Equity
$70,363
Purchase Details
Closed on
Dec 23, 2004
Bought by
Mosler Jolene Sue
Purchase Details
Closed on
Jun 13, 2002
Bought by
Stokes Fannie Etal
Create a Home Valuation Report for This Property
The Home Valuation Report is an in-depth analysis detailing your home's value as well as a comparison with similar homes in the area
Home Values in the Area
Average Home Value in this Area
Purchase History
| Date | Buyer | Sale Price | Title Company |
|---|---|---|---|
| Phelan Angela J | $70,000 | None Available | |
| Mosler Jolene Sue | $70,000 | -- | |
| Stokes Fannie Etal | -- | -- |
Source: Public Records
Mortgage History
| Date | Status | Borrower | Loan Amount |
|---|---|---|---|
| Open | Phelan Angela J | $69,088 |
Source: Public Records
Tax History Compared to Growth
Tax History
| Year | Tax Paid | Tax Assessment Tax Assessment Total Assessment is a certain percentage of the fair market value that is determined by local assessors to be the total taxable value of land and additions on the property. | Land | Improvement |
|---|---|---|---|---|
| 2025 | $1,010 | $9,357 | $513 | $8,844 |
| 2024 | $1,010 | $10,474 | $513 | $9,961 |
| 2023 | $1,010 | $10,783 | $513 | $10,270 |
| 2022 | $949 | $10,269 | $513 | $9,756 |
| 2021 | $924 | $9,780 | $513 | $9,267 |
| 2020 | $888 | $9,314 | $513 | $8,801 |
| 2019 | $728 | $8,871 | $513 | $8,358 |
| 2018 | $733 | $8,871 | $513 | $8,358 |
| 2017 | $745 | $8,871 | $513 | $8,358 |
| 2016 | $725 | $9,018 | $513 | $8,505 |
| 2015 | $709 | $7,980 | $465 | $7,515 |
| 2014 | $757 | $9,237 | $513 | $8,724 |
Source: Public Records
Map
Nearby Homes