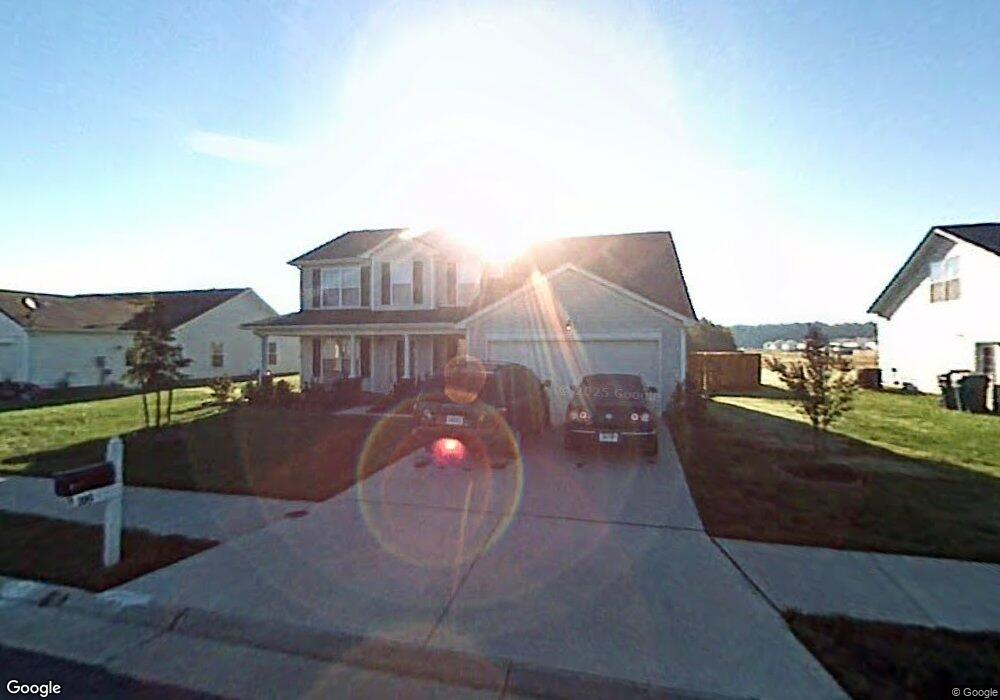
209 Bridgewater Ct Suffolk, VA 23434
Cyprus NeighborhoodEstimated Value: $465,000 - $475,000
4
Beds
3
Baths
2,640
Sq Ft
$178/Sq Ft
Est. Value
About This Home
This home is located at 209 Bridgewater Ct, Suffolk, VA 23434 and is currently estimated at $470,710, approximately $178 per square foot. 209 Bridgewater Ct is a home located in Suffolk City with nearby schools including Nansemond Parkway Elementary School, John Yeates Middle School, and Nansemond River High School.
Ownership History
Date
Name
Owned For
Owner Type
Purchase Details
Closed on
Apr 17, 2012
Sold by
Steele Louise M and Beamon Rita A
Bought by
Frarey Christopher F
Current Estimated Value
Home Financials for this Owner
Home Financials are based on the most recent Mortgage that was taken out on this home.
Original Mortgage
$229,042
Outstanding Balance
$156,498
Interest Rate
3.91%
Mortgage Type
FHA
Estimated Equity
$314,212
Create a Home Valuation Report for This Property
The Home Valuation Report is an in-depth analysis detailing your home's value as well as a comparison with similar homes in the area
Home Values in the Area
Average Home Value in this Area
Purchase History
| Date | Buyer | Sale Price | Title Company |
|---|---|---|---|
| Frarey Christopher F | $235,000 | -- |
Source: Public Records
Mortgage History
| Date | Status | Borrower | Loan Amount |
|---|---|---|---|
| Open | Frarey Christopher F | $229,042 |
Source: Public Records
Tax History
| Year | Tax Paid | Tax Assessment Tax Assessment Total Assessment is a certain percentage of the fair market value that is determined by local assessors to be the total taxable value of land and additions on the property. | Land | Improvement |
|---|---|---|---|---|
| 2025 | $5,261 | $449,600 | $85,000 | $364,600 |
| 2024 | $5,261 | $438,300 | $85,000 | $353,300 |
| 2023 | $5,083 | $422,700 | $85,000 | $337,700 |
| 2022 | $4,111 | $377,200 | $85,000 | $292,200 |
| 2021 | $3,304 | $297,700 | $72,900 | $224,800 |
| 2020 | $3,185 | $286,900 | $72,900 | $214,000 |
| 2019 | $3,121 | $281,200 | $72,900 | $208,300 |
| 2018 | $3,133 | $282,200 | $72,900 | $209,300 |
| 2017 | $2,937 | $274,500 | $72,900 | $201,600 |
| 2016 | $2,854 | $266,700 | $72,900 | $193,800 |
| 2015 | $1,443 | $267,700 | $72,900 | $194,800 |
| 2014 | $1,443 | $267,700 | $72,900 | $194,800 |
Source: Public Records
Map
Nearby Homes
- 112 Kennet Dr
- 3352 Oyster Creek Dr
- .25AC Nansemond Pkwy
- 202 Ferguson Place
- 3104 Nansemond Pkwy
- 3405 Dumpling Ct
- 3411 Mintonville Point Dr
- 3409 Mintonville Point Dr
- 3413 Mintonville Point Dr
- 1012 Bennetts Pasture Rd
- 6026 Sam Callis Cir
- 4010 Evan Cir
- 6033 Sam Callis Cir
- 4315 Edgewater Ln
- 2774 Nansemond Pkwy
- 2772 Nansemond Pkwy
- Lot 1 Nansemond Pkwy
- 4015 Sleepy Hole Rd
- 125 Ct
- 2102 King St
- 211 Bridgewater Ct
- 207 Bridgewater Ct
- 205 Bridgewater Ct
- 213 Bridgewater Ct
- 205 Bridewater Ct
- 203 Bridgewater Ct
- 215 Bridgewater Ct
- 214 Bridgewater Ct
- 217 Bridgewater Ct
- 188 Rochdale Ln
- 151 Kennet Dr
- 183 Rochdale Ln
- 149 Kennet Dr
- 216 Bridgewater Ct
- 186 Rochdale Ln
- 147 Kennet Dr
- 219 Bridgewater Ct
- 184 Rochdale Ln
- 145 Kennet Dr
- 221 Bridgewater Ct
Your Personal Tour Guide
Ask me questions while you tour the home.