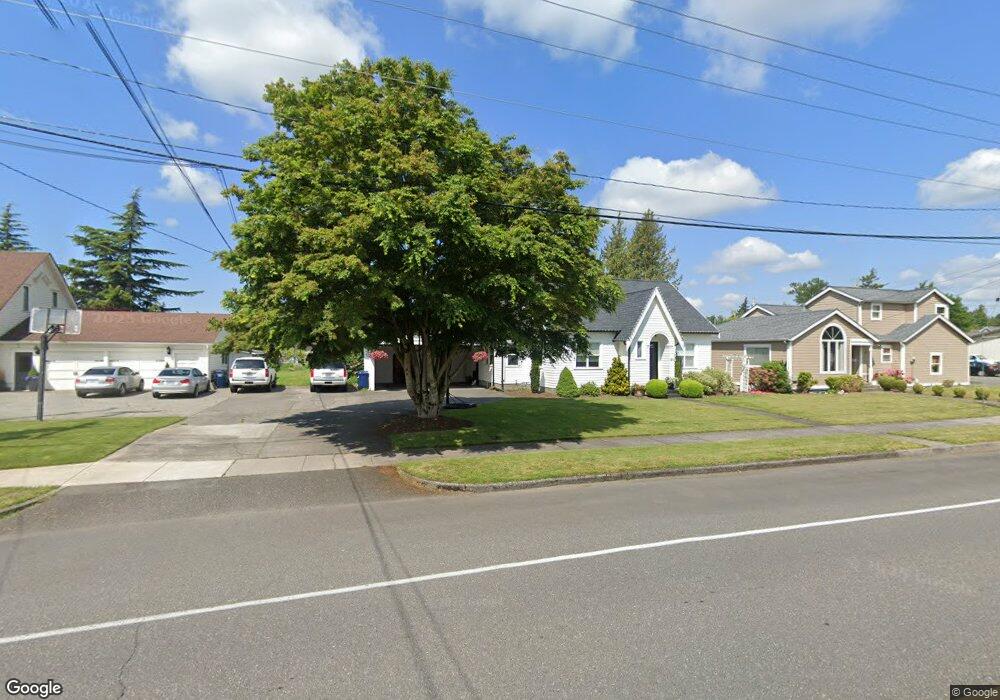
209 British Columbia Ave Lynden, WA 98264
Estimated Value: $510,122 - $566,000
4
Beds
2
Baths
1,271
Sq Ft
$425/Sq Ft
Est. Value
About This Home
This home is located at 209 British Columbia Ave, Lynden, WA 98264 and is currently estimated at $540,781, approximately $425 per square foot. 209 British Columbia Ave is a home located in Whatcom County with nearby schools including Lynden High School, Lynden Christian School, and Lynden Christian Schools: Administration.
Ownership History
Date
Name
Owned For
Owner Type
Purchase Details
Closed on
Feb 8, 2007
Sold by
Fisher Clyde
Bought by
Gimse Joshua
Current Estimated Value
Purchase Details
Closed on
Nov 9, 2006
Sold by
Gimse Stefanie
Bought by
Gimse Joshua
Purchase Details
Closed on
Nov 6, 2006
Sold by
Gimse Joshua
Bought by
Fisher Clyde and 209 N British Columbia Avenue
Purchase Details
Closed on
Feb 26, 2006
Sold by
Gimse Joshua
Bought by
Bos Lamont R and Bos Emily D
Home Financials for this Owner
Home Financials are based on the most recent Mortgage that was taken out on this home.
Original Mortgage
$251,000
Interest Rate
6.21%
Mortgage Type
Purchase Money Mortgage
Purchase Details
Closed on
Mar 9, 2004
Sold by
Burger Rodney H and Miriam Burger A
Bought by
Gimse Joshua and Gimse Stefanie
Home Financials for this Owner
Home Financials are based on the most recent Mortgage that was taken out on this home.
Original Mortgage
$187,000
Interest Rate
6.87%
Mortgage Type
Purchase Money Mortgage
Create a Home Valuation Report for This Property
The Home Valuation Report is an in-depth analysis detailing your home's value as well as a comparison with similar homes in the area
Home Values in the Area
Average Home Value in this Area
Purchase History
| Date | Buyer | Sale Price | Title Company |
|---|---|---|---|
| Gimse Joshua | -- | None Available | |
| Gimse Joshua | -- | None Available | |
| Fisher Clyde | -- | None Available | |
| Bos Lamont R | $251,280 | Stewart Title Company | |
| Gimse Joshua | $220,000 | Stewart Title Company |
Source: Public Records
Mortgage History
| Date | Status | Borrower | Loan Amount |
|---|---|---|---|
| Previous Owner | Bos Lamont R | $251,000 | |
| Previous Owner | Gimse Joshua | $187,000 |
Source: Public Records
Tax History Compared to Growth
Tax History
| Year | Tax Paid | Tax Assessment Tax Assessment Total Assessment is a certain percentage of the fair market value that is determined by local assessors to be the total taxable value of land and additions on the property. | Land | Improvement |
|---|---|---|---|---|
| 2024 | $3,486 | $489,905 | $194,000 | $295,905 |
| 2023 | $3,486 | $484,524 | $200,000 | $284,524 |
| 2022 | $3,115 | $408,511 | $109,660 | $298,851 |
| 2021 | $3,055 | $337,608 | $90,627 | $246,981 |
| 2020 | $2,677 | $301,444 | $80,919 | $220,525 |
| 2019 | $2,382 | $276,445 | $74,297 | $202,148 |
| 2018 | $2,603 | $252,131 | $67,682 | $184,449 |
| 2017 | $2,364 | $226,309 | $60,750 | $165,559 |
| 2016 | $2,227 | $218,543 | $55,000 | $163,543 |
| 2015 | $1,974 | $204,777 | $52,900 | $151,877 |
| 2014 | -- | $197,841 | $51,100 | $146,741 |
| 2013 | -- | $196,741 | $50,000 | $146,741 |
Source: Public Records
Map
Nearby Homes
- 1218 Front St
- 0 Guide Meridian Unit NWM2369980
- 2016 Steelhead Way
- 403 17th St
- 908 Glenning St
- 1717 E St
- 200 8th St
- 106 Fairside Dr Unit D
- 1584 Main St
- 515 17th St
- 416 Stremler Dr
- 518 Edson St
- 1774 Farmview Terrace
- 104 Riverwalk Dr
- 206 Pebblebrook Dr
- 207 Pebblebrook Dr
- 205 Pebblebrook Dr
- 207 Riverwalk Dr
- 208 Riverwalk Dr
- 116 Riverwalk Dr
- 211 British Columbia Ave
- 1304 Grover St
- 205 British Columbia Ave
- 214 14th St
- 300 S B C Ave
- 209 14th St
- 208 British Columbia Ave
- 303 British Columbia Ave
- 1314 Grover St
- 1201 Liberty St
- 300 14th St
- 209 12th St
- 305 British Columbia Ave
- 306 14th St
- 213 14th St
- 115 British Columbia Ave
- 1402 Grover St
- 309 British Columbia Ave
- 308 14th St
- 1209 Grover St