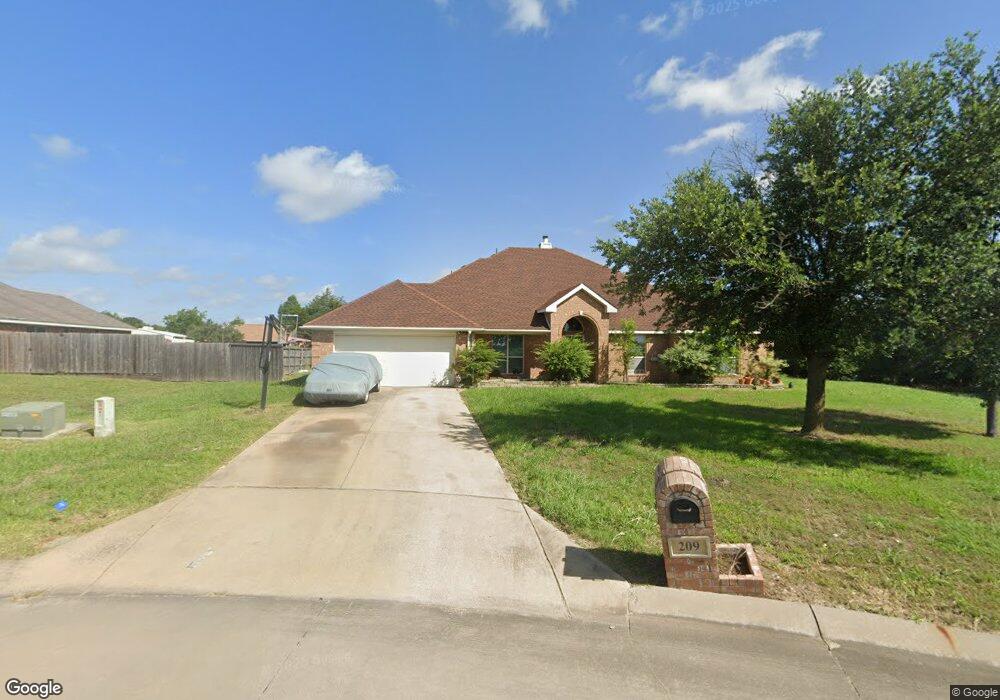
209 Brittany Dr Royse City, TX 75189
Estimated Value: $434,000 - $493,000
4
Beds
3
Baths
2,687
Sq Ft
$171/Sq Ft
Est. Value
About This Home
This home is located at 209 Brittany Dr, Royse City, TX 75189 and is currently estimated at $459,145, approximately $170 per square foot. 209 Brittany Dr is a home located in Rockwall County with nearby schools including Harry H. Herndon Elementary School, Bobby Summers Middle School, and Royse City High School.
Ownership History
Date
Name
Owned For
Owner Type
Purchase Details
Closed on
Sep 12, 2016
Sold by
Neel Melissa Coe and Shull Brent
Bought by
Coleman Ryan R
Current Estimated Value
Home Financials for this Owner
Home Financials are based on the most recent Mortgage that was taken out on this home.
Original Mortgage
$258,400
Outstanding Balance
$206,731
Interest Rate
3.48%
Mortgage Type
New Conventional
Estimated Equity
$252,414
Purchase Details
Closed on
Jun 15, 2011
Sold by
Burkart Scott M and Burkart Kara
Bought by
Neel Melissa Coe
Home Financials for this Owner
Home Financials are based on the most recent Mortgage that was taken out on this home.
Original Mortgage
$182,384
Interest Rate
4.74%
Mortgage Type
New Conventional
Purchase Details
Closed on
Feb 17, 2006
Sold by
Crestmark Properties Inc
Bought by
Burkart Scott M and Burkart Kara
Home Financials for this Owner
Home Financials are based on the most recent Mortgage that was taken out on this home.
Original Mortgage
$168,900
Interest Rate
6.19%
Mortgage Type
Fannie Mae Freddie Mac
Create a Home Valuation Report for This Property
The Home Valuation Report is an in-depth analysis detailing your home's value as well as a comparison with similar homes in the area
Home Values in the Area
Average Home Value in this Area
Purchase History
| Date | Buyer | Sale Price | Title Company |
|---|---|---|---|
| Coleman Ryan R | -- | None Available | |
| Neel Melissa Coe | -- | Nat | |
| Burkart Scott M | -- | None Available |
Source: Public Records
Mortgage History
| Date | Status | Borrower | Loan Amount |
|---|---|---|---|
| Open | Coleman Ryan R | $258,400 | |
| Previous Owner | Neel Melissa Coe | $182,384 | |
| Previous Owner | Burkart Scott M | $168,900 |
Source: Public Records
Tax History Compared to Growth
Tax History
| Year | Tax Paid | Tax Assessment Tax Assessment Total Assessment is a certain percentage of the fair market value that is determined by local assessors to be the total taxable value of land and additions on the property. | Land | Improvement |
|---|---|---|---|---|
| 2025 | $5,671 | $430,680 | -- | -- |
| 2023 | $5,671 | $355,934 | $0 | $0 |
| 2022 | $6,566 | $323,576 | $0 | $0 |
| 2021 | $6,034 | $294,160 | $105,000 | $189,160 |
| 2020 | $6,273 | $288,560 | $103,000 | $185,560 |
| 2019 | $6,198 | $280,840 | $71,300 | $209,540 |
| 2018 | $5,687 | $246,090 | $58,140 | $187,950 |
| 2017 | $5,799 | $248,160 | $58,140 | $190,020 |
| 2016 | $5,163 | $220,920 | $55,500 | $165,420 |
| 2015 | $4,913 | $213,950 | $30,000 | $183,950 |
| 2014 | $4,913 | $217,610 | $30,000 | $187,610 |
Source: Public Records
Map
Nearby Homes
- 125 Jerome Prairie
- 108 Shelby Dr
- 108 Shady Springs Ln
- 1108 Blackland Rd
- 216 Grant Dr
- 105 James St
- 102 Katie St
- 2050 Clearmist Way
- 253 Pitt Cir
- 102 Packer Dr
- 506 Robinson Way
- 3031 Concourse Dr
- 428 Attlee Dr
- 304 Eden Dr
- 1041 N Churchill Dr
- 569 Baker Ct
- 227 Chamberlain Dr
- 2014 Slow Stream Dr
- Plan Rodin at Waterscape - 50ft. lots
- 1006 Watercourse Place
- 207 Brittany Dr
- 130 Cottonwood Dr
- 132 Cottonwood Dr
- 207 Jeremy Dr
- 205 Brittany Dr
- 128 Cottonwood Dr
- 205 Jeremy Dr
- 101 Derrick
- 101 Derrick
- 203 Brittany Dr
- 100 Evans Dr
- 126 Cottonwood Dr
- 101 Evans Dr
- 103 Derrick
- 203 Jeremy Dr
- 201 Brittany Dr
- 124 Cottonwood Dr
- 103 Evans Dr
- 102 Evans Dr
- 127 Cottonwood Dr