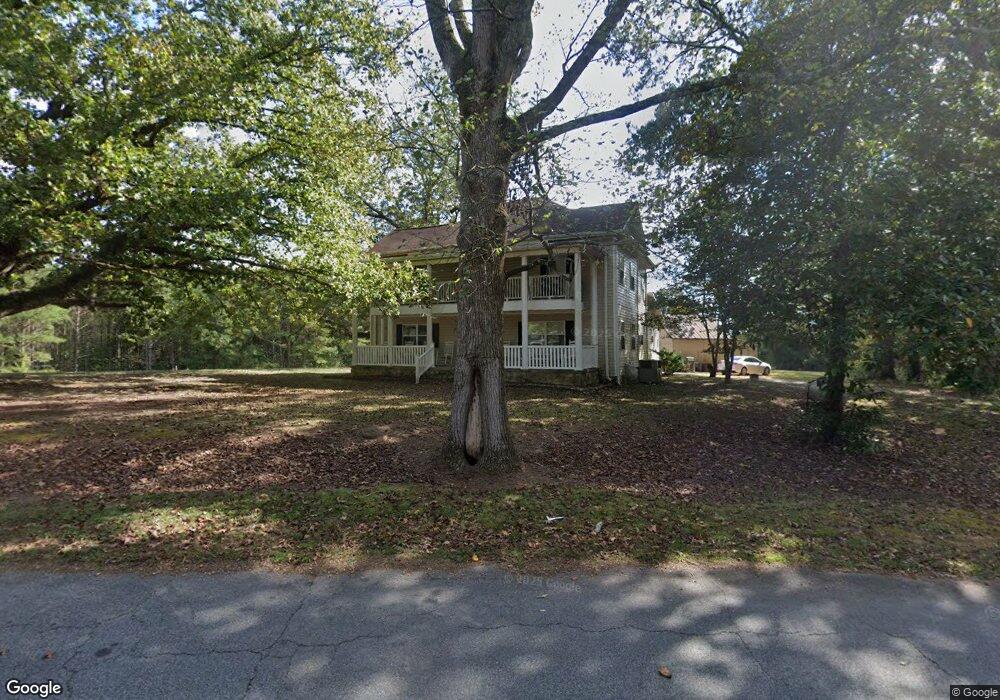
209 Bushmill Rd Bremen, GA 30110
Estimated Value: $391,839 - $478,000
3
Beds
3
Baths
2,855
Sq Ft
$152/Sq Ft
Est. Value
About This Home
This home is located at 209 Bushmill Rd, Bremen, GA 30110 and is currently estimated at $434,210, approximately $152 per square foot. 209 Bushmill Rd is a home located in Haralson County with nearby schools including Haralson County High School.
Ownership History
Date
Name
Owned For
Owner Type
Purchase Details
Closed on
Jun 2, 2008
Sold by
Lizotte Jan W
Bought by
Whitton Wayne E and Whitton Dorothy
Current Estimated Value
Purchase Details
Closed on
Oct 5, 2007
Sold by
Wade Kristen Leigh
Bought by
Wade Joseph Dave
Purchase Details
Closed on
Sep 7, 2004
Sold by
Flanagan William Kevin
Bought by
Lizotte Jan W and Rosemarie Kennedy
Purchase Details
Closed on
Apr 29, 2004
Sold by
Citizens Bank & Trust Of West Georgia
Bought by
Flanagan William Kevin
Purchase Details
Closed on
Feb 28, 2003
Sold by
Baker Dena E Nell Estate By Eady Samuel
Bought by
Flanagan William Kevin
Purchase Details
Closed on
Feb 14, 2003
Sold by
Eady H B Estate By Eady Samuel H
Bought by
Flanagan William Kevin
Purchase Details
Closed on
Feb 13, 2003
Sold by
Connell Peggy E
Bought by
Flanagan William Kevin
Purchase Details
Closed on
Feb 12, 2003
Sold by
Eady Samuel H
Bought by
Flanagan William Kevin
Create a Home Valuation Report for This Property
The Home Valuation Report is an in-depth analysis detailing your home's value as well as a comparison with similar homes in the area
Home Values in the Area
Average Home Value in this Area
Purchase History
| Date | Buyer | Sale Price | Title Company |
|---|---|---|---|
| Whitton Wayne E | $244,000 | -- | |
| Wade Joseph Dave | -- | -- | |
| Lizotte Jan W | $210,000 | -- | |
| Lizotte Jan W | $210,000 | -- | |
| Flanagan William Kevin | -- | -- | |
| Flanagan William Kevin | -- | -- | |
| Flanagan William Kevin | $250,000 | -- | |
| Flanagan William Kevin | -- | -- | |
| Flanagan William Kevin | -- | -- | |
| Flanagan William Kevin | -- | -- |
Source: Public Records
Tax History Compared to Growth
Tax History
| Year | Tax Paid | Tax Assessment Tax Assessment Total Assessment is a certain percentage of the fair market value that is determined by local assessors to be the total taxable value of land and additions on the property. | Land | Improvement |
|---|---|---|---|---|
| 2024 | $2,526 | $108,312 | $12,374 | $95,938 |
| 2023 | $2,760 | $113,801 | $10,286 | $103,515 |
| 2022 | $2,270 | $95,518 | $10,286 | $85,232 |
| 2021 | $2,351 | $90,498 | $9,474 | $81,024 |
| 2020 | $2,391 | $91,560 | $9,474 | $82,086 |
| 2019 | $2,385 | $88,138 | $9,474 | $78,664 |
| 2018 | $2,421 | $88,138 | $9,474 | $78,664 |
| 2017 | $2,282 | $76,246 | $9,474 | $66,772 |
| 2016 | $1,779 | $64,431 | $10,318 | $54,113 |
| 2015 | $1,765 | $63,948 | $10,318 | $53,631 |
| 2014 | $1,778 | $65,366 | $10,318 | $55,048 |
Source: Public Records
Map
Nearby Homes
- 101 Bush Creek Way
- 16 Garrett Ave
- 104 Eaves Rd
- 317 Lakeview Dr
- 1045 Highway 27 N
- 273 Sewell Rd
- 1121 Highway 27 N
- 311 Kensington Cir
- 330 Kensington Cir
- 12 C W Smith Cir
- 80 C W Smith Cir
- 117 Marchman St
- 1875 Old Ridgeway Rd
- 91 Sewell Rd
- 111 Bryan St W
- 586 Old Bushmill Rd
- 6315 Highway 78
- 0 Sewell Rd Unit 10624236
- 0 Sewell Rd Unit 7665305
- 522 Atlantic Ave
- 215 Bushmill Rd
- 204 Bush Mill Rd
- 204 Bushmill Rd
- 240 Bushmill Rd
- 225 Bushmill Rd
- 225 Bush Mill Rd
- 172 Bush Mill Rd
- 172 Bushmill Rd
- 237 Bush Mill Rd
- 237 Bushmill Rd
- 100 Baker Dr
- 162 Bushmill Rd
- 253 Bush Mill Rd
- 253 Bushmill Rd
- 260 Bushmill Rd
- 152 Bushmill Rd
- 121 Bush Mill Rd
- 121 Bushmill Rd
- 0 Eady Dr Unit 6002951
- 0 Eady Dr Unit 8369165