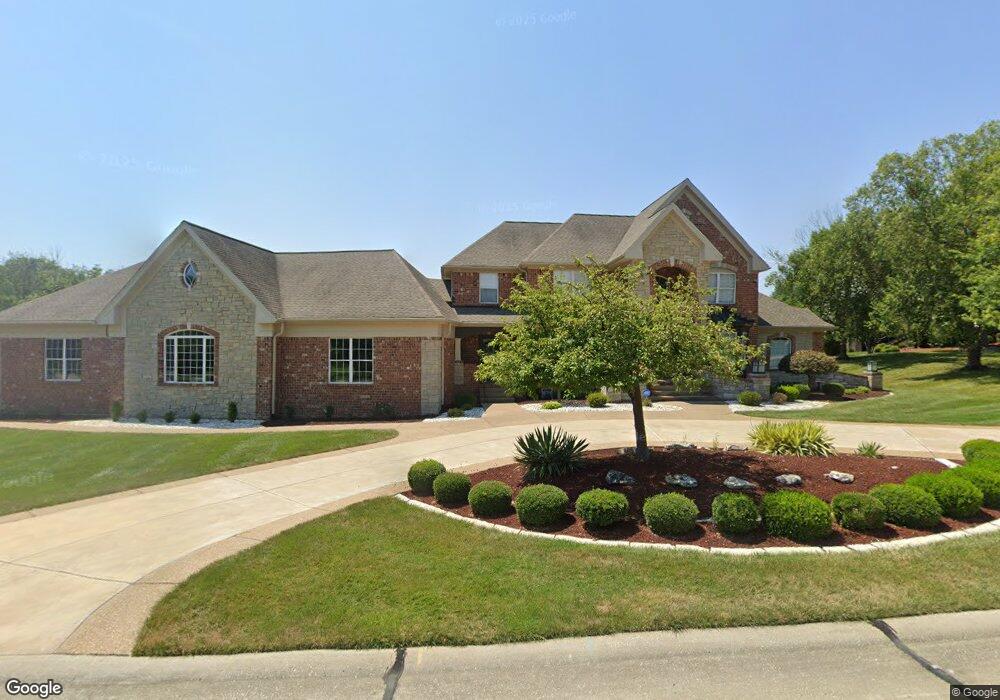
209 Camelot Dr Weldon Spring, MO 63304
Estimated Value: $1,230,000 - $1,370,000
4
Beds
6
Baths
4,357
Sq Ft
$300/Sq Ft
Est. Value
About This Home
This home is located at 209 Camelot Dr, Weldon Spring, MO 63304 and is currently estimated at $1,305,515, approximately $299 per square foot. 209 Camelot Dr is a home located in St. Charles County with nearby schools including Independence Elementary School, Bryan Middle School, and Francis Howell Union High School.
Ownership History
Date
Name
Owned For
Owner Type
Purchase Details
Closed on
Jun 28, 2007
Sold by
Foster Thomas and Foster Angela
Bought by
Whalen Bernard A and Whalen Robyn L
Current Estimated Value
Home Financials for this Owner
Home Financials are based on the most recent Mortgage that was taken out on this home.
Original Mortgage
$417,000
Outstanding Balance
$258,864
Interest Rate
6.37%
Mortgage Type
Purchase Money Mortgage
Estimated Equity
$1,046,651
Purchase Details
Closed on
Feb 12, 2002
Sold by
Reinhart John B
Bought by
Foster Thomas and Foster Angela
Home Financials for this Owner
Home Financials are based on the most recent Mortgage that was taken out on this home.
Original Mortgage
$124,000
Interest Rate
6.83%
Purchase Details
Closed on
Sep 29, 2000
Sold by
Whittaker Construction Incorporated
Bought by
Reinhart John B
Create a Home Valuation Report for This Property
The Home Valuation Report is an in-depth analysis detailing your home's value as well as a comparison with similar homes in the area
Home Values in the Area
Average Home Value in this Area
Purchase History
| Date | Buyer | Sale Price | Title Company |
|---|---|---|---|
| Whalen Bernard A | $875,000 | Inv | |
| Foster Thomas | -- | -- | |
| Reinhart John B | -- | -- |
Source: Public Records
Mortgage History
| Date | Status | Borrower | Loan Amount |
|---|---|---|---|
| Open | Whalen Bernard A | $417,000 | |
| Previous Owner | Foster Thomas | $124,000 |
Source: Public Records
Tax History
| Year | Tax Paid | Tax Assessment Tax Assessment Total Assessment is a certain percentage of the fair market value that is determined by local assessors to be the total taxable value of land and additions on the property. | Land | Improvement |
|---|---|---|---|---|
| 2025 | $11,597 | $213,451 | -- | -- |
| 2023 | $11,592 | $195,132 | $0 | $0 |
| 2022 | $9,873 | $154,369 | $0 | $0 |
| 2021 | $9,882 | $154,369 | $0 | $0 |
| 2020 | $9,361 | $141,535 | $0 | $0 |
| 2019 | $9,318 | $141,535 | $0 | $0 |
| 2018 | $9,698 | $140,868 | $0 | $0 |
| 2017 | $9,618 | $140,868 | $0 | $0 |
| 2016 | $9,591 | $135,309 | $0 | $0 |
| 2015 | $9,543 | $135,309 | $0 | $0 |
| 2014 | $9,351 | $128,606 | $0 | $0 |
Source: Public Records
Map
Nearby Homes
- 265 Camelot Dr
- 74 W Meath Ring
- 59 W Meath Ring
- 102 Enclave Terrace Ct
- 828 Nancy Ln
- 149 Shaelah Ct
- 1094 Whitmoor Dr
- 4 Upper Whitmoor Dr
- 6 Whitmoor Ct
- 4489 Austin Valley Ct
- 41 Wolfrum Rd
- 32 Rathfarnum Ln
- 5013 Royal Burgess Dr
- 3624 Capri Way
- 862 Whitmoor Dr
- 3424 Capri Way
- 50 Crocknaraw Ln
- 3312 Capri Way
- 5527 Hennsley Cir
- 1 Belcourt Cir
- 213 Camelot Dr
- 205 Camelot Dr
- 204 Camelot Dr
- 208 Camelot Dr
- 212 Camelot Dr
- 50 Agravaine Ct
- 216 Camelot Dr
- 20 Agravaine Ct
- 40 Agravaine Ct
- 30 Agravaine Ct
- 201 Camelot Dr
- 220 Camelot Dr
- 200 Camelot Dr
- 221 Camelot Dr
- 202 Wizard Ct
- 224 Camelot Dr
- 203 Wizard Ct
- 5401 Gareth Dr
- 5405 Gareth Dr
- 5421 Gareth Dr
Your Personal Tour Guide
Ask me questions while you tour the home.