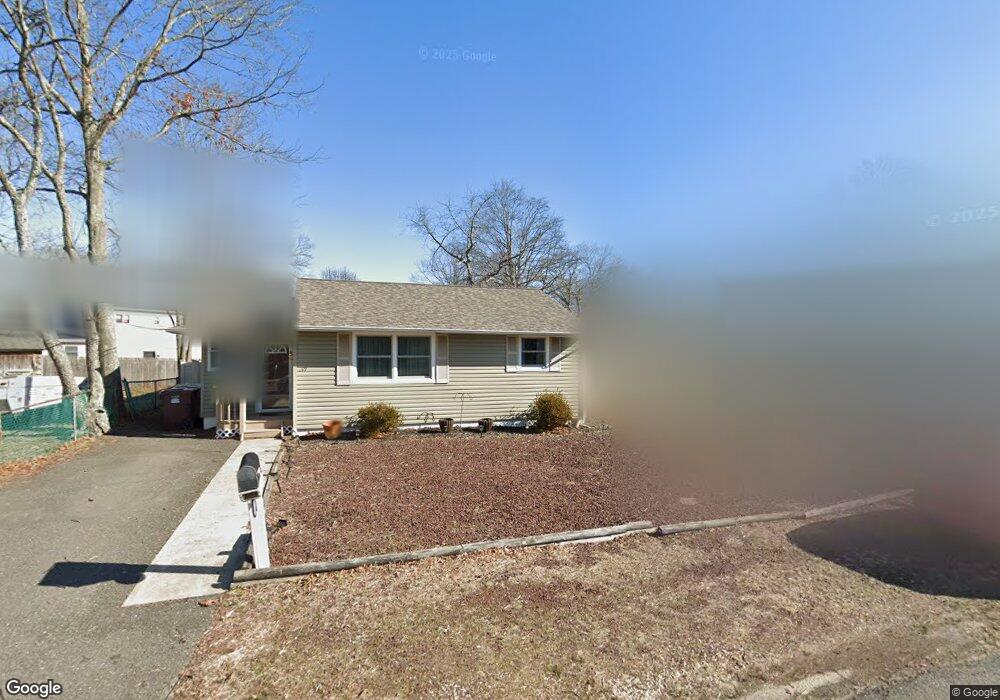
209 Cape May Ave Bayville, NJ 08721
Estimated Value: $309,196 - $381,000
2
Beds
1
Bath
872
Sq Ft
$382/Sq Ft
Est. Value
About This Home
This home is located at 209 Cape May Ave, Bayville, NJ 08721 and is currently estimated at $332,799, approximately $381 per square foot. 209 Cape May Ave is a home located in Ocean County with nearby schools including Central Regional Middle School, Central Regional High School, and Ocean Academy.
Ownership History
Date
Name
Owned For
Owner Type
Purchase Details
Closed on
May 31, 2002
Sold by
Aryeh Moshe
Bought by
Burke Carol
Current Estimated Value
Home Financials for this Owner
Home Financials are based on the most recent Mortgage that was taken out on this home.
Original Mortgage
$91,715
Outstanding Balance
$39,026
Interest Rate
6.9%
Estimated Equity
$293,773
Purchase Details
Closed on
Mar 16, 2001
Sold by
Gertsen Ernest
Bought by
Aryeh Moshe
Home Financials for this Owner
Home Financials are based on the most recent Mortgage that was taken out on this home.
Original Mortgage
$75,150
Interest Rate
6.93%
Purchase Details
Closed on
Oct 11, 1994
Sold by
Nj Natl Bk
Bought by
Gertsen Ernest and Gertsen Carol
Home Financials for this Owner
Home Financials are based on the most recent Mortgage that was taken out on this home.
Original Mortgage
$50,000
Interest Rate
8.71%
Create a Home Valuation Report for This Property
The Home Valuation Report is an in-depth analysis detailing your home's value as well as a comparison with similar homes in the area
Home Values in the Area
Average Home Value in this Area
Purchase History
| Date | Buyer | Sale Price | Title Company |
|---|---|---|---|
| Burke Carol | $107,900 | -- | |
| Aryeh Moshe | $83,500 | -- | |
| Aryeh Moshe | $83,500 | -- | |
| Gertsen Ernest | $56,000 | -- | |
| Demarco Scott | $56,000 | -- |
Source: Public Records
Mortgage History
| Date | Status | Borrower | Loan Amount |
|---|---|---|---|
| Open | Burke Carol | $91,715 | |
| Previous Owner | Aryeh Moshe | $75,150 | |
| Previous Owner | Demarco Scott | $50,000 |
Source: Public Records
Tax History Compared to Growth
Tax History
| Year | Tax Paid | Tax Assessment Tax Assessment Total Assessment is a certain percentage of the fair market value that is determined by local assessors to be the total taxable value of land and additions on the property. | Land | Improvement |
|---|---|---|---|---|
| 2025 | $3,797 | $157,500 | $90,100 | $67,400 |
| 2024 | $3,654 | $157,500 | $90,100 | $67,400 |
| 2023 | $3,586 | $157,500 | $90,100 | $67,400 |
| 2022 | $3,586 | $157,500 | $90,100 | $67,400 |
| 2021 | $3,372 | $157,500 | $90,100 | $67,400 |
| 2020 | $3,511 | $157,500 | $90,100 | $67,400 |
| 2019 | $3,413 | $157,500 | $90,100 | $67,400 |
| 2018 | $3,402 | $157,500 | $90,100 | $67,400 |
| 2017 | $3,276 | $157,500 | $90,100 | $67,400 |
| 2016 | $3,259 | $157,500 | $90,100 | $67,400 |
| 2015 | $3,169 | $157,500 | $90,100 | $67,400 |
| 2014 | $3,079 | $157,500 | $90,100 | $67,400 |
Source: Public Records
Map
Nearby Homes
- 238 Lakewood Ave
- 257 Ocean Gate Turnpike
- 803 Ocean Gate Dr
- 227 Chelsea Ave
- 253 Shore Blvd
- 87 Puffin Glade Unit 87
- 3 Sheila Ct
- Madison Plan at Golden Eagles Estates
- Cambridge Plan at Golden Eagles Estates
- Dover Plan at Golden Eagles Estates
- 0 Jane Ave
- 553 Ocean Gate Dr
- 99 Holly Ln
- 39 Ivy Ct
- 36 W Point Pleasant Ave
- 315 Tudor Ave
- 32 E Long Branch Ave
- 918 Prospect Ave
- 65 Pelican Dr
- 32 Pine Tree Dr
- 213 Cape May Ave
- 208 Point Pleasant Ave
- 111 Mill Creek Rd
- 206 Point Pleasant Ave
- 208 Cape May Ave
- 212 Point Pleasant Ave
- 216 Point Pleasant Ave
- 301 Neptune Ave
- 315 Neptune Ave
- 112 Mill Creek Rd
- 110 Mill Creek Rd
- 217 Cape May Ave
- 209 Point Pleasant Ave
- 306 Neptune Ave
- 119 Mill Creek Rd
- 207 Point Pleasant Ave
- 215 Point Pleasant Ave
- 2 Michelle Ln
- 221 Cape May Ave
- 305 Neptune Ave