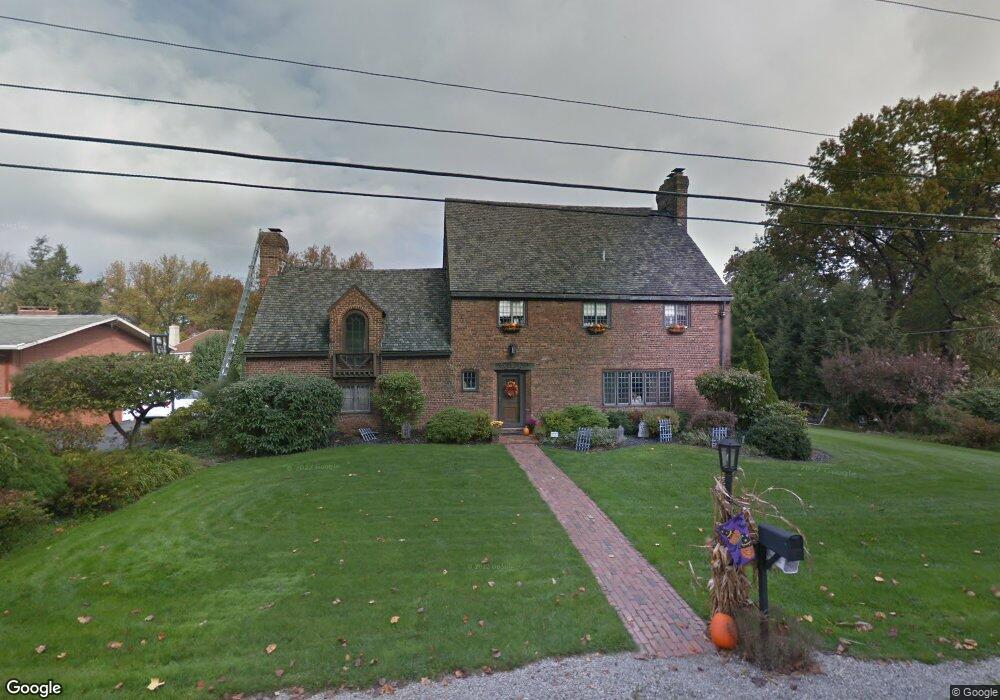
209 Cedar Rd Butler, PA 16001
Butler NeighborhoodEstimated Value: $145,958 - $460,000
4
Beds
3
Baths
2,774
Sq Ft
$127/Sq Ft
Est. Value
About This Home
This home is located at 209 Cedar Rd, Butler, PA 16001 and is currently estimated at $351,490, approximately $126 per square foot. 209 Cedar Rd is a home located in Butler County with nearby schools including Butler Middle School, Butler Intermediate High School, and First Baptist Christian School.
Ownership History
Date
Name
Owned For
Owner Type
Purchase Details
Closed on
Oct 27, 2015
Sold by
Rosen Rodney D
Bought by
Rosen Marcy E
Current Estimated Value
Home Financials for this Owner
Home Financials are based on the most recent Mortgage that was taken out on this home.
Original Mortgage
$238,600
Outstanding Balance
$188,179
Interest Rate
3.87%
Mortgage Type
Unknown
Estimated Equity
$163,311
Purchase Details
Closed on
Jul 7, 2006
Sold by
Wesner Franz J
Bought by
Rosen Rodney D
Home Financials for this Owner
Home Financials are based on the most recent Mortgage that was taken out on this home.
Original Mortgage
$220,000
Interest Rate
6.6%
Create a Home Valuation Report for This Property
The Home Valuation Report is an in-depth analysis detailing your home's value as well as a comparison with similar homes in the area
Home Values in the Area
Average Home Value in this Area
Purchase History
| Date | Buyer | Sale Price | Title Company |
|---|---|---|---|
| Rosen Marcy E | -- | None Available | |
| Rosen Rodney D | $295,000 | -- |
Source: Public Records
Mortgage History
| Date | Status | Borrower | Loan Amount |
|---|---|---|---|
| Open | Rosen Marcy E | $238,600 | |
| Previous Owner | Rosen Rodney D | $220,000 |
Source: Public Records
Tax History Compared to Growth
Tax History
| Year | Tax Paid | Tax Assessment Tax Assessment Total Assessment is a certain percentage of the fair market value that is determined by local assessors to be the total taxable value of land and additions on the property. | Land | Improvement |
|---|---|---|---|---|
| 2025 | $4,307 | $29,000 | $5,800 | $23,200 |
| 2024 | $4,230 | $29,000 | $5,800 | $23,200 |
| 2023 | $4,144 | $29,000 | $5,800 | $23,200 |
| 2022 | $4,144 | $29,000 | $5,800 | $23,200 |
| 2021 | $4,144 | $29,000 | $0 | $0 |
| 2020 | $4,144 | $29,000 | $5,800 | $23,200 |
| 2019 | $4,056 | $29,000 | $5,800 | $23,200 |
| 2018 | $4,056 | $29,000 | $5,800 | $23,200 |
| 2017 | $3,964 | $29,000 | $5,800 | $23,200 |
| 2016 | $1,251 | $29,000 | $5,800 | $23,200 |
| 2015 | $588 | $29,000 | $5,800 | $23,200 |
| 2014 | $588 | $29,000 | $5,800 | $23,200 |
Source: Public Records
Map
Nearby Homes