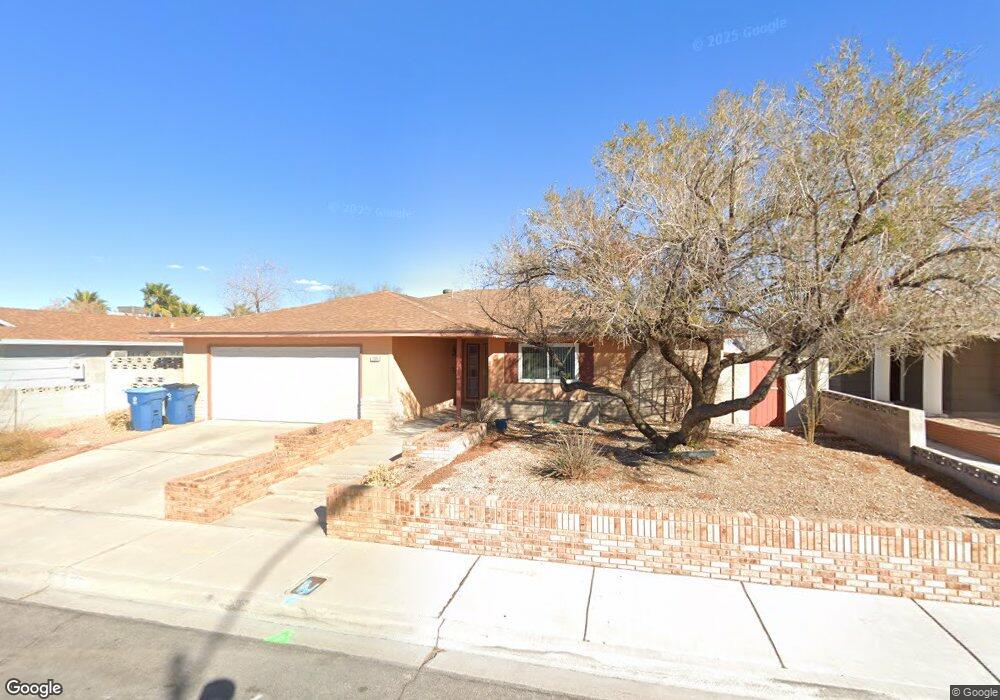
209 Celia Place Las Vegas, NV 89145
Angel Park NeighborhoodEstimated Value: $381,536 - $434,000
3
Beds
2
Baths
1,620
Sq Ft
$255/Sq Ft
Est. Value
About This Home
This home is located at 209 Celia Place, Las Vegas, NV 89145 and is currently estimated at $412,884, approximately $254 per square foot. 209 Celia Place is a home located in Clark County with nearby schools including Walter Jacobson Elementary School, Walter Johnson Junior High School Academy of International Studies, and Bonanza High School.
Ownership History
Date
Name
Owned For
Owner Type
Purchase Details
Closed on
Apr 25, 2022
Sold by
Tom Hawley Trust
Bought by
Brown Ronen and Brown Alejandra Kicillof
Current Estimated Value
Home Financials for this Owner
Home Financials are based on the most recent Mortgage that was taken out on this home.
Original Mortgage
$281,250
Outstanding Balance
$262,566
Interest Rate
4.16%
Mortgage Type
Balloon
Estimated Equity
$150,318
Purchase Details
Closed on
Sep 11, 2018
Sold by
Hawley Thomas S
Bought by
Hawley Thomas Shell and Tom Hawley Trust
Purchase Details
Closed on
Nov 27, 2000
Sold by
Milam Roy A and Milam Angel M
Bought by
Hawley Thomas S
Home Financials for this Owner
Home Financials are based on the most recent Mortgage that was taken out on this home.
Original Mortgage
$104,000
Interest Rate
7.81%
Create a Home Valuation Report for This Property
The Home Valuation Report is an in-depth analysis detailing your home's value as well as a comparison with similar homes in the area
Home Values in the Area
Average Home Value in this Area
Purchase History
| Date | Buyer | Sale Price | Title Company |
|---|---|---|---|
| Brown Ronen | $375,000 | None Listed On Document | |
| Hawley Thomas Shell | -- | None Available | |
| Hawley Thomas S | $130,000 | Old Republic Title Company |
Source: Public Records
Mortgage History
| Date | Status | Borrower | Loan Amount |
|---|---|---|---|
| Open | Brown Ronen | $281,250 | |
| Previous Owner | Hawley Thomas S | $104,000 | |
| Closed | Hawley Thomas S | $13,000 |
Source: Public Records
Tax History
| Year | Tax Paid | Tax Assessment Tax Assessment Total Assessment is a certain percentage of the fair market value that is determined by local assessors to be the total taxable value of land and additions on the property. | Land | Improvement |
|---|---|---|---|---|
| 2026 | $1,259 | $66,084 | $38,500 | $27,584 |
| 2025 | $1,222 | $64,617 | $35,700 | $28,917 |
| 2024 | $1,187 | $64,617 | $35,700 | $28,917 |
| 2023 | $1,187 | $62,570 | $33,950 | $28,620 |
| 2022 | $1,153 | $53,302 | $26,600 | $26,702 |
| 2021 | $1,119 | $50,056 | $24,150 | $25,906 |
| 2020 | $1,036 | $49,986 | $23,800 | $26,186 |
| 2019 | $971 | $45,842 | $19,600 | $26,242 |
| 2018 | $927 | $44,098 | $18,550 | $25,548 |
| 2017 | $1,353 | $41,284 | $15,050 | $26,234 |
| 2016 | $869 | $39,040 | $11,900 | $27,140 |
| 2015 | $866 | $37,680 | $10,500 | $27,180 |
| 2014 | $841 | $29,286 | $6,475 | $22,811 |
Source: Public Records
Map
Nearby Homes
- 212 Bradshaw Way
- 204 Bradshaw Way
- 7753 Cherry River Dr
- 7725 Genzer Dr
- 7625 Genzer Dr
- 332 S Buffalo Dr Unit 202
- 105 N Cimarron Rd
- 332 Huntly Rd Unit 13C
- 557 Yacht Harbor Dr
- 7803 Foxwood Place Unit 4
- 333 Huntly Rd
- 8220 Abercrombe Way
- 549 Yacht Harbor Dr
- 7806 Cliffside Ct
- 8229 Charles Turk Dr
- 8025 Mt Royal Ct
- 8212 Confetti Cir
- 7904 Idledale Ct Unit 203
- 7404 Bagdad Ct
- 313 Firestone Dr
- 205 Celia Place
- 213 Celia Place
- 208 Scherer St
- 204 Scherer St
- 201 Celia Place
- 208 Celia Place
- 204 Celia Place
- 200 Scherer St
- 212 Celia Place
- 133 Celia Place
- 7805 Aplin Ave
- 7809 Aplin Ave
- 132 Scherer St
- 7813 Aplin Ave
- 7801 Aplin Ave
- 132 Celia Place
- 209 Tighe Way
- 209 Scherer St
- 205 Tighe Way
- 213 Tighe Way
Your Personal Tour Guide
Ask me questions while you tour the home.