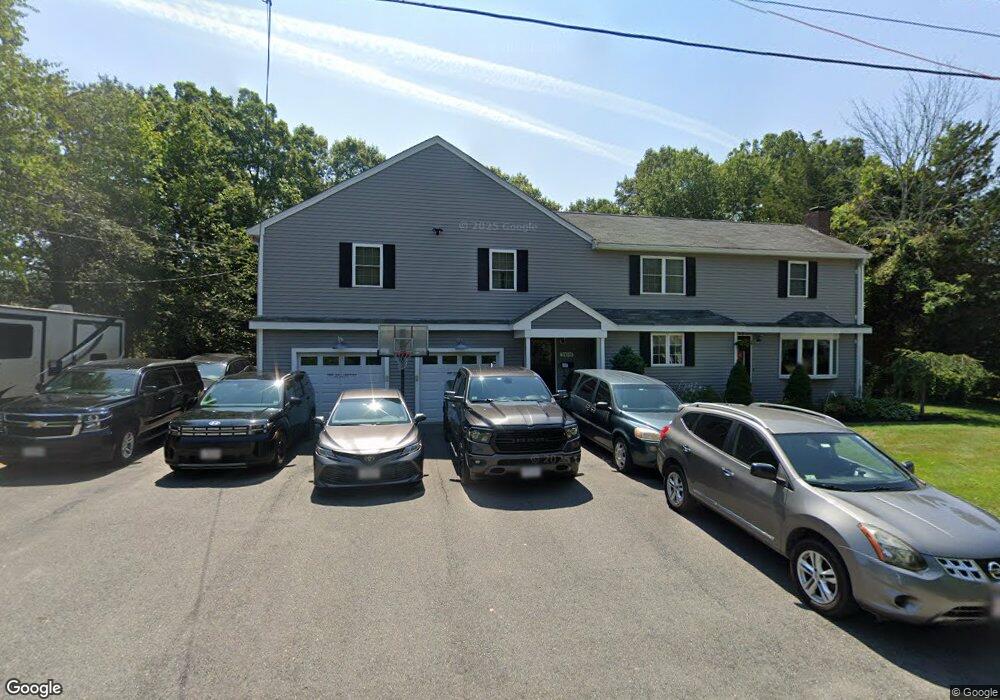
209 Coe Rd Brockton, MA 02302
Montello NeighborhoodEstimated Value: $657,323 - $946,000
3
Beds
1
Bath
3,588
Sq Ft
$216/Sq Ft
Est. Value
About This Home
This home is located at 209 Coe Rd, Brockton, MA 02302 and is currently estimated at $776,081, approximately $216 per square foot. 209 Coe Rd is a home located in Plymouth County with nearby schools including Brookfield Elementary School, Downey Elementary School, and Ashfield Middle School.
Ownership History
Date
Name
Owned For
Owner Type
Purchase Details
Closed on
Dec 19, 1994
Sold by
Fhlmc
Bought by
Lambert Christopher J and Kelly Janet M
Current Estimated Value
Purchase Details
Closed on
Nov 8, 1994
Sold by
Mullin Richard F and Rodier Lori A
Bought by
Fhlmc
Purchase Details
Closed on
Mar 28, 1988
Sold by
Ronan Philip W
Bought by
Mullin Richard F
Create a Home Valuation Report for This Property
The Home Valuation Report is an in-depth analysis detailing your home's value as well as a comparison with similar homes in the area
Home Values in the Area
Average Home Value in this Area
Purchase History
| Date | Buyer | Sale Price | Title Company |
|---|---|---|---|
| Lambert Christopher J | $80,000 | -- | |
| Fhlmc | $64,600 | -- | |
| Mullin Richard F | $127,900 | -- |
Source: Public Records
Mortgage History
| Date | Status | Borrower | Loan Amount |
|---|---|---|---|
| Open | Mullin Richard F | $31,000 | |
| Open | Mullin Richard F | $49,500 |
Source: Public Records
Tax History Compared to Growth
Tax History
| Year | Tax Paid | Tax Assessment Tax Assessment Total Assessment is a certain percentage of the fair market value that is determined by local assessors to be the total taxable value of land and additions on the property. | Land | Improvement |
|---|---|---|---|---|
| 2025 | $7,297 | $602,600 | $158,500 | $444,100 |
| 2024 | $6,806 | $566,200 | $158,500 | $407,700 |
| 2023 | $6,622 | $510,200 | $124,400 | $385,800 |
| 2022 | $6,500 | $465,300 | $113,500 | $351,800 |
| 2021 | $6,293 | $434,000 | $103,500 | $330,500 |
| 2020 | $6,874 | $453,700 | $99,200 | $354,500 |
| 2019 | $6,631 | $426,700 | $92,400 | $334,300 |
| 2018 | $5,952 | $370,600 | $92,400 | $278,200 |
| 2017 | $6,150 | $382,000 | $92,400 | $289,600 |
| 2016 | $5,765 | $332,100 | $88,900 | $243,200 |
| 2015 | $5,808 | $320,000 | $88,900 | $231,100 |
| 2014 | $5,782 | $318,900 | $88,900 | $230,000 |
Source: Public Records
Map
Nearby Homes