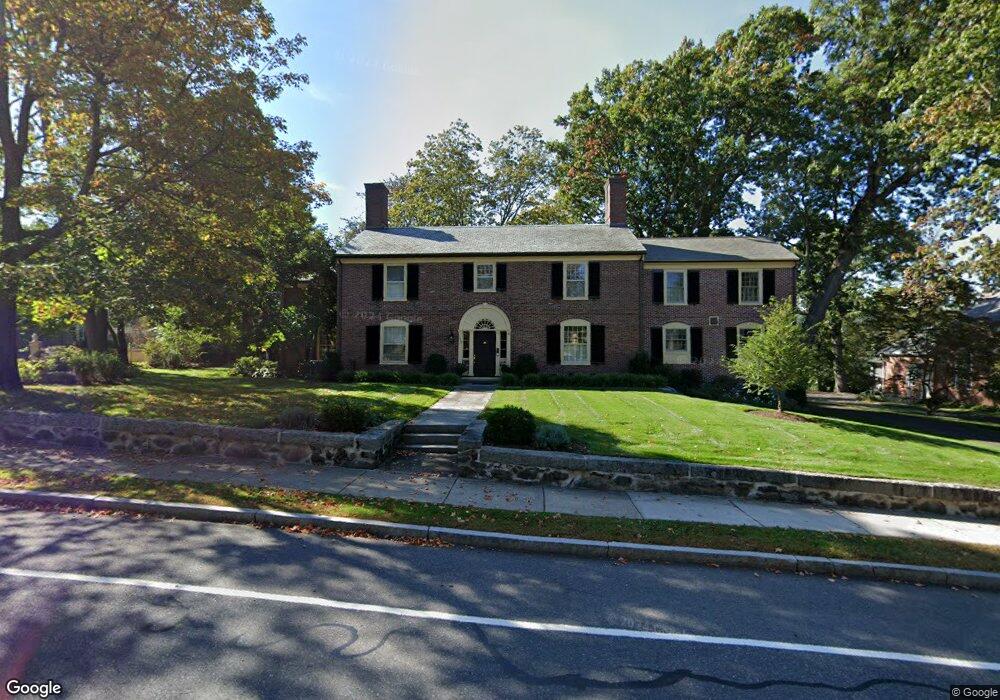
209 Common St Belmont, MA 02478
Belmont Center NeighborhoodEstimated Value: $2,856,171 - $3,041,000
5
Beds
3
Baths
4,040
Sq Ft
$728/Sq Ft
Est. Value
About This Home
This home is located at 209 Common St, Belmont, MA 02478 and is currently estimated at $2,943,043, approximately $728 per square foot. 209 Common St is a home located in Middlesex County with nearby schools including Roger Wellington Elementary School, Winthrop L Chenery Middle School, and Belmont High School.
Ownership History
Date
Name
Owned For
Owner Type
Purchase Details
Closed on
Feb 24, 2009
Sold by
Kilzer Anne G and Mcevoy David L
Bought by
Bolte Benjamin L and Bolte Cassandra K
Current Estimated Value
Home Financials for this Owner
Home Financials are based on the most recent Mortgage that was taken out on this home.
Original Mortgage
$750,000
Outstanding Balance
$475,125
Interest Rate
5.06%
Mortgage Type
Purchase Money Mortgage
Estimated Equity
$2,467,918
Purchase Details
Closed on
Mar 5, 2004
Sold by
Danzey Leslie J and Soave Leslie J
Bought by
Kilbourn Susan D
Home Financials for this Owner
Home Financials are based on the most recent Mortgage that was taken out on this home.
Original Mortgage
$264,000
Interest Rate
5.62%
Mortgage Type
Purchase Money Mortgage
Purchase Details
Closed on
Nov 25, 2003
Sold by
Soave Leslie J and Soave John
Bought by
Soave Leslie J
Create a Home Valuation Report for This Property
The Home Valuation Report is an in-depth analysis detailing your home's value as well as a comparison with similar homes in the area
Home Values in the Area
Average Home Value in this Area
Purchase History
| Date | Buyer | Sale Price | Title Company |
|---|---|---|---|
| Bolte Benjamin L | $1,280,000 | -- | |
| Kilbourn Susan D | $330,000 | -- | |
| Danzey Leslie | -- | -- | |
| Soave Leslie J | -- | -- |
Source: Public Records
Mortgage History
| Date | Status | Borrower | Loan Amount |
|---|---|---|---|
| Open | Bolte Benjamin L | $750,000 | |
| Previous Owner | Kilbourn Susan D | $264,000 |
Source: Public Records
Tax History Compared to Growth
Tax History
| Year | Tax Paid | Tax Assessment Tax Assessment Total Assessment is a certain percentage of the fair market value that is determined by local assessors to be the total taxable value of land and additions on the property. | Land | Improvement |
|---|---|---|---|---|
| 2025 | $30,912 | $2,714,000 | $1,114,000 | $1,600,000 |
| 2024 | $26,812 | $2,539,000 | $1,388,000 | $1,151,000 |
| 2023 | $24,661 | $2,194,000 | $1,059,000 | $1,135,000 |
| 2022 | $21,984 | $1,986,000 | $969,000 | $1,017,000 |
| 2021 | $19,531 | $1,905,000 | $1,060,000 | $845,000 |
| 2020 | $21,538 | $1,958,000 | $1,131,000 | $827,000 |
| 2019 | $20,119 | $1,724,000 | $934,000 | $790,000 |
| 2018 | $18,772 | $1,545,000 | $755,000 | $790,000 |
| 2017 | $18,807 | $1,482,000 | $692,000 | $790,000 |
| 2016 | $18,526 | $1,475,000 | $692,000 | $783,000 |
| 2015 | $17,415 | $1,350,000 | $591,000 | $759,000 |
Source: Public Records
Map
Nearby Homes
- 263 Common St
- 69 Horace Rd
- 38 Myrtle St
- 1 Spinney Terrace
- 160 Waverley St
- 36 Madison St
- 72-74 Flett Rd
- 59-61 Gilbert Rd
- 33 Slade St Unit 1
- 66 Channing Rd
- 55-57 Hawthorne St
- 23 Centre Ave
- 125 Trapelo Rd Unit 21
- 125 Trapelo Rd Unit 23
- 2 Bartlett Ave Unit 1
- 105 Watson Rd
- 33 Wellington Ln
- 88 Bartlett Ave
- 48 Concord Ave
- 73 Trowbridge St Unit 73A