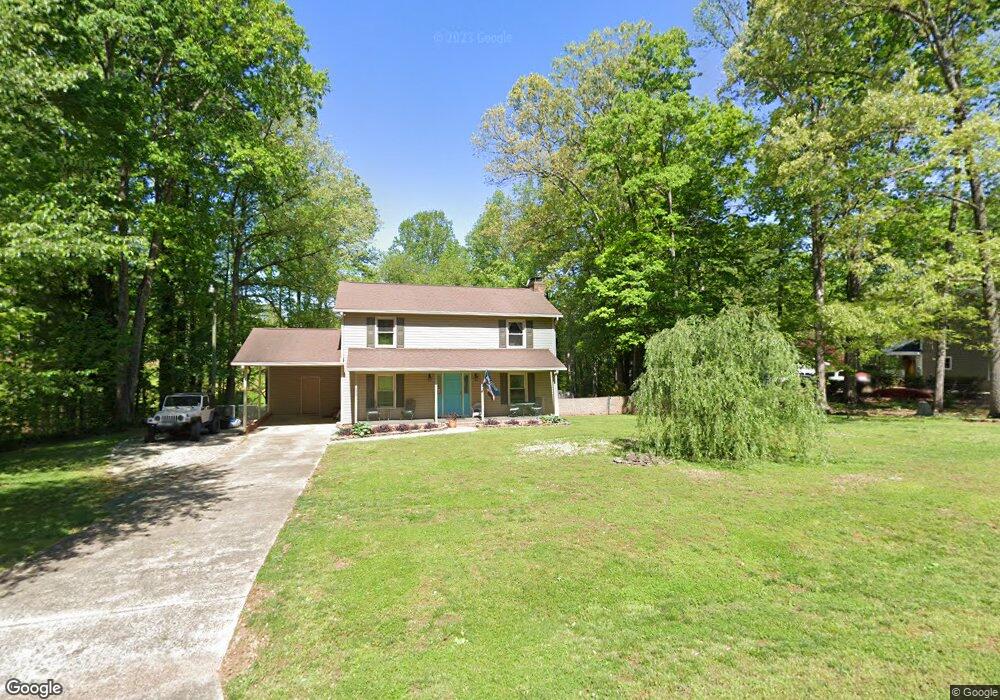
209 Cottonwood Dr Unit L 5 Mount Holly, NC 28120
Estimated Value: $333,870 - $368,000
3
Beds
3
Baths
1,650
Sq Ft
$214/Sq Ft
Est. Value
About This Home
This home is located at 209 Cottonwood Dr Unit L 5, Mount Holly, NC 28120 and is currently estimated at $353,218, approximately $214 per square foot. 209 Cottonwood Dr Unit L 5 is a home located in Gaston County with nearby schools including Rankin Elementary School, Mount Holly Middle School, and East Gaston High School.
Ownership History
Date
Name
Owned For
Owner Type
Purchase Details
Closed on
Oct 14, 2019
Sold by
Whitesides Stephen Andrew and Whitesides Stephanie Marie
Bought by
Horne Brandy M and Lewis Mark W
Current Estimated Value
Home Financials for this Owner
Home Financials are based on the most recent Mortgage that was taken out on this home.
Original Mortgage
$205,214
Outstanding Balance
$180,217
Interest Rate
3.62%
Mortgage Type
FHA
Estimated Equity
$173,001
Purchase Details
Closed on
Nov 30, 2016
Sold by
Ladue William H and Ladue Mary R
Bought by
Whitesides Stephen Andrew and Whitesides Stephanie Marie
Home Financials for this Owner
Home Financials are based on the most recent Mortgage that was taken out on this home.
Original Mortgage
$156,750
Interest Rate
3.52%
Mortgage Type
New Conventional
Purchase Details
Closed on
Apr 12, 1994
Bought by
Ladue William H and Ladue Mary R
Create a Home Valuation Report for This Property
The Home Valuation Report is an in-depth analysis detailing your home's value as well as a comparison with similar homes in the area
Home Values in the Area
Average Home Value in this Area
Purchase History
| Date | Buyer | Sale Price | Title Company |
|---|---|---|---|
| Horne Brandy M | $209,000 | None Available | |
| Whitesides Stephen Andrew | $165,000 | None Available | |
| Ladue William H | $98,500 | -- |
Source: Public Records
Mortgage History
| Date | Status | Borrower | Loan Amount |
|---|---|---|---|
| Open | Horne Brandy M | $205,214 | |
| Previous Owner | Whitesides Stephen Andrew | $156,750 |
Source: Public Records
Tax History Compared to Growth
Tax History
| Year | Tax Paid | Tax Assessment Tax Assessment Total Assessment is a certain percentage of the fair market value that is determined by local assessors to be the total taxable value of land and additions on the property. | Land | Improvement |
|---|---|---|---|---|
| 2025 | $1,999 | $279,990 | $37,500 | $242,490 |
| 2024 | $1,999 | $279,990 | $37,500 | $242,490 |
| 2023 | $1,946 | $279,990 | $37,500 | $242,490 |
| 2022 | $1,749 | $190,100 | $24,000 | $166,100 |
| 2021 | $1,753 | $190,100 | $24,000 | $166,100 |
| 2019 | $1,734 | $190,100 | $24,000 | $166,100 |
| 2018 | $1,341 | $140,584 | $24,000 | $116,584 |
| 2017 | $1,341 | $140,584 | $24,000 | $116,584 |
| 2016 | $1,341 | $140,584 | $0 | $0 |
| 2014 | $1,289 | $135,101 | $30,000 | $105,101 |
Source: Public Records
Map
Nearby Homes
- 101 Cottonwood Dr
- 1029 Old Nc 27 Hwy
- 5041 Mooreland Oaks Way
- 3505 Sycamore Crossing Ct
- 1315 Old N C 27 Hwy
- TA4000 Plan at Mooreland Oaks
- Devin Plan at Mooreland Oaks
- Cyprus Plan at Mooreland Oaks
- Lenox Plan at Mooreland Oaks
- Jasper Plan at Mooreland Oaks
- Bayside Plan at Mooreland Oaks
- Kipling Plan at Mooreland Oaks
- Riley Plan at Mooreland Oaks
- Montcrest Plan at Mooreland Oaks
- Huntley Plan at Mooreland Oaks
- Ava Plan at Mooreland Oaks
- Declan Plan at Mooreland Oaks
- Hudson Plan at Mooreland Oaks
- Winslow Plan at Mooreland Oaks
- 112 Elk Ct
- 209 Cottonwood Dr
- 207 Cottonwood Dr
- 211 Cottonwood Dr
- 210 Cottonwood Dr
- 212 Cottonwood Dr Unit 7
- 212 Cottonwood Dr
- 212 Plantation Dr Unit WF-77
- 205 Cottonwood Dr
- 208 Cottonwood Dr
- 3865 Rosewood Dr
- 202 Plantation Dr
- 301 Cottonwood Dr
- 206 Cottonwood Dr
- 3859 Rosewood Dr
- 1202 Azalea Trail
- 102 Magnolia Ln
- 3862 Rosewood Dr
- 1206 Azalea Trail
- 3810 Rosewood Dr
- 3805 Rosewood Dr