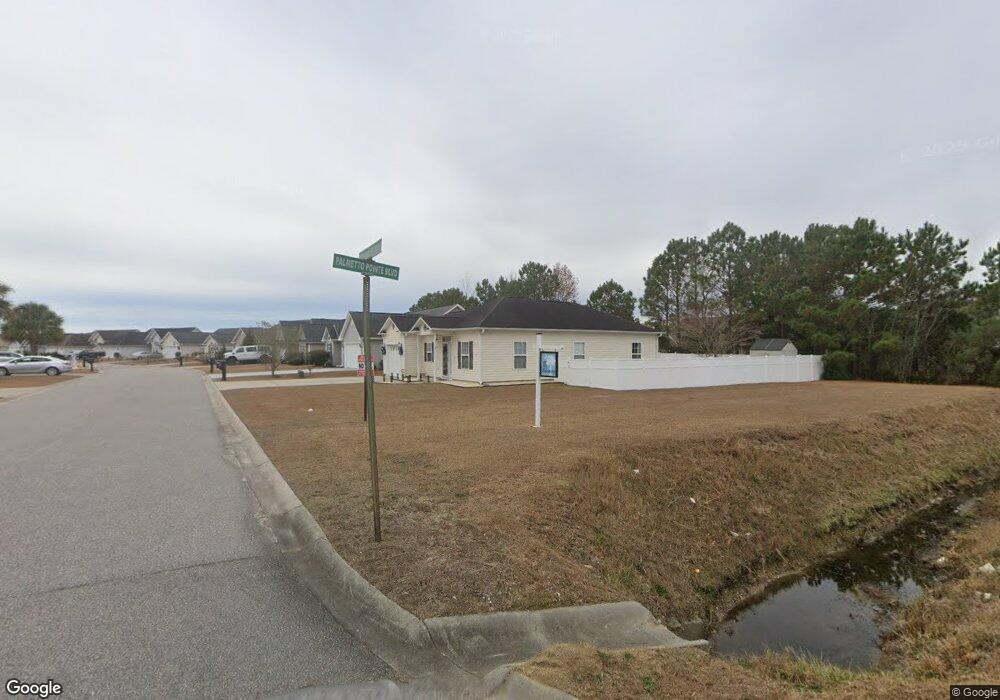
209 Dry Valley Loop Unit LOT 28 Myrtle Beach, SC 29588
Estimated Value: $262,000 - $287,000
3
Beds
2
Baths
1,300
Sq Ft
$209/Sq Ft
Est. Value
About This Home
This home is located at 209 Dry Valley Loop Unit LOT 28, Myrtle Beach, SC 29588 and is currently estimated at $271,854, approximately $209 per square foot. 209 Dry Valley Loop Unit LOT 28 is a home located in Horry County with nearby schools including Lakewood Elementary, Socastee Middle, and Socastee High School.
Ownership History
Date
Name
Owned For
Owner Type
Purchase Details
Closed on
Oct 7, 2024
Sold by
Petruzzelli Ariana N
Bought by
Faber Timothy and Faber Deborah
Current Estimated Value
Purchase Details
Closed on
Jun 2, 2021
Sold by
Little David E
Bought by
Petruzzelli Ariana N
Home Financials for this Owner
Home Financials are based on the most recent Mortgage that was taken out on this home.
Original Mortgage
$212,578
Interest Rate
2.9%
Mortgage Type
New Conventional
Purchase Details
Closed on
Jan 6, 2017
Sold by
Gilbert Michelle and Gilbert Scott
Bought by
Little David E and Little Eleanor G
Home Financials for this Owner
Home Financials are based on the most recent Mortgage that was taken out on this home.
Original Mortgage
$118
Interest Rate
4.13%
Mortgage Type
New Conventional
Create a Home Valuation Report for This Property
The Home Valuation Report is an in-depth analysis detailing your home's value as well as a comparison with similar homes in the area
Home Values in the Area
Average Home Value in this Area
Purchase History
| Date | Buyer | Sale Price | Title Company |
|---|---|---|---|
| Faber Timothy | $260,000 | -- | |
| Petruzzelli Ariana N | $216,500 | -- | |
| Little David E | $14,800 | None Available |
Source: Public Records
Mortgage History
| Date | Status | Borrower | Loan Amount |
|---|---|---|---|
| Previous Owner | Petruzzelli Ariana N | $212,578 | |
| Previous Owner | Little David E | $118 |
Source: Public Records
Tax History Compared to Growth
Tax History
| Year | Tax Paid | Tax Assessment Tax Assessment Total Assessment is a certain percentage of the fair market value that is determined by local assessors to be the total taxable value of land and additions on the property. | Land | Improvement |
|---|---|---|---|---|
| 2024 | $840 | $10,172 | $2,422 | $7,750 |
| 2023 | $1,063 | $6,345 | $1,573 | $4,772 |
| 2021 | $1,028 | $6,345 | $1,573 | $4,772 |
| 2020 | $597 | $6,345 | $1,573 | $4,772 |
| 2019 | $597 | $6,345 | $1,573 | $4,772 |
| 2018 | $1,910 | $5,848 | $1,128 | $4,720 |
| 2017 | $446 | $4,648 | $1,128 | $3,520 |
| 2016 | -- | $4,648 | $1,128 | $3,520 |
| 2015 | $454 | $4,649 | $1,129 | $3,520 |
| 2014 | $421 | $4,649 | $1,129 | $3,520 |
Source: Public Records
Map
Nearby Homes
- 205 Atoll Dr
- 313 Harbour Reef Dr
- 578 Banks Dr Unit 82
- 232 Palm Cove Cir Unit Palm Cove
- 228 Palm Cove Cir
- 220 Palm Cove Cir
- 117 Butkus Dr Unit 6
- 117 Butkus Dr Unit 2
- 109 Butkus Dr Unit 3
- 118 Butkus Dr Unit 2
- 140 Olde Towne Way Unit 2
- 140 Olde Towne Way Unit 1
- 355 Brackish Dr Unit 355
- 3979 Forsythia Ct Unit 203
- 3979 Forsythia Ct Unit Azalea Lakes 201
- 3979 Forsythia Ct Unit 204 AZALEA LAKES
- 113 Olde Towne Way Unit 3
- 3973 Forsythia Ct Unit 103
- 134 Butkus Dr Unit 7
- 135 Butkus Dr Unit 1
- 209 Dry Valley Loop
- 205 Dry Valley Loop
- 205 Dry Valley Loop Unit Lot 27 The Hideaway
- 101 Point Break Dr
- 201 Dry Valley Loop
- 201 Dry Valley Loop Unit LOT 26
- 105 Point Break Dr
- 208 Dry Valley Loop
- 204 Dry Valley Loop
- 197 Dry Valley Loop
- 200 Dry Valley Loop
- 109 Point Break Dr
- 200 Atoll Dr
- 196 Dry Valley Loop
- 193 Dry Valley Loop
- 113 Point Break Dr
- 190 Dry Valley Loop
- 201 Atoll Dr Unit MB
- 204 Atoll Dr
- 189 Dry Valley Loop