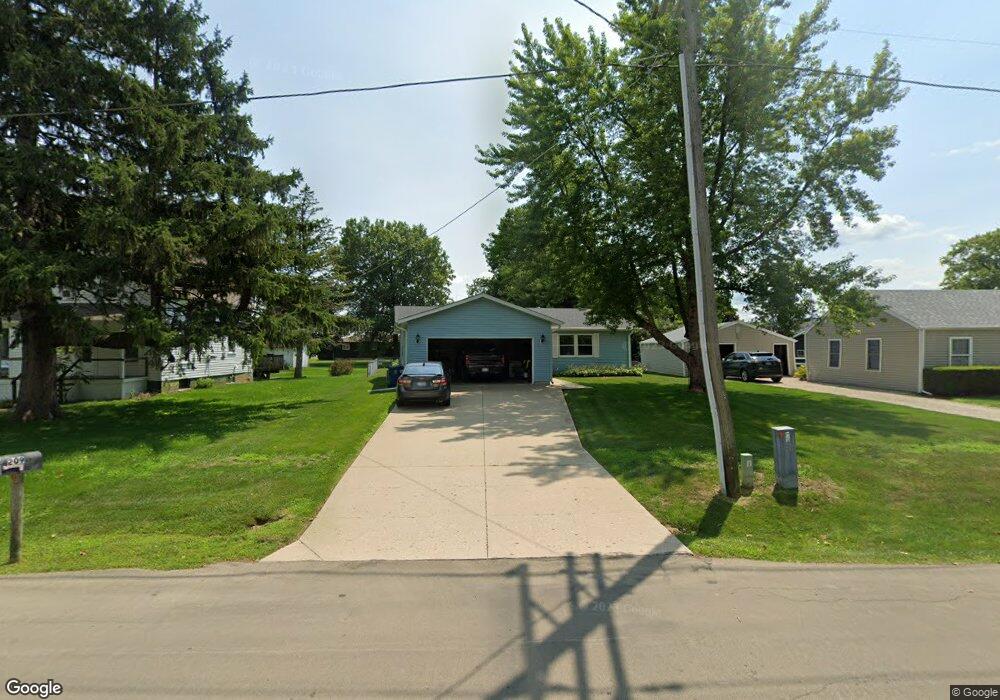
209 E Brown St Earlville, IL 60518
Estimated Value: $179,000 - $226,000
Studio
--
Bath
1,288
Sq Ft
$162/Sq Ft
Est. Value
About This Home
This home is located at 209 E Brown St, Earlville, IL 60518 and is currently estimated at $208,601, approximately $161 per square foot. 209 E Brown St is a home located in LaSalle County with nearby schools including Earlville Elementary School and Earlville Junior/Senior High School.
Ownership History
Date
Name
Owned For
Owner Type
Purchase Details
Closed on
Jul 13, 2018
Sold by
Shannon Jeremy W
Bought by
Greer James B
Current Estimated Value
Home Financials for this Owner
Home Financials are based on the most recent Mortgage that was taken out on this home.
Original Mortgage
$112,500
Outstanding Balance
$97,498
Interest Rate
4.5%
Mortgage Type
New Conventional
Estimated Equity
$111,103
Create a Home Valuation Report for This Property
The Home Valuation Report is an in-depth analysis detailing your home's value as well as a comparison with similar homes in the area
Purchase History
| Date | Buyer | Sale Price | Title Company |
|---|---|---|---|
| Greer James B | $125,000 | Wheatland Title |
Source: Public Records
Mortgage History
| Date | Status | Borrower | Loan Amount |
|---|---|---|---|
| Open | Greer James B | $112,500 |
Source: Public Records
Tax History
| Year | Tax Paid | Tax Assessment Tax Assessment Total Assessment is a certain percentage of the fair market value that is determined by local assessors to be the total taxable value of land and additions on the property. | Land | Improvement |
|---|---|---|---|---|
| 2024 | $4,511 | $59,813 | $2,598 | $57,215 |
| 2023 | $4,071 | $52,834 | $2,295 | $50,539 |
| 2022 | $3,758 | $47,372 | $5,088 | $42,284 |
| 2021 | $3,828 | $46,562 | $5,001 | $41,561 |
| 2020 | $3,698 | $45,166 | $4,851 | $40,315 |
| 2019 | $3,601 | $43,213 | $4,641 | $38,572 |
| 2018 | $4,285 | $43,397 | $4,463 | $38,934 |
| 2017 | $4,013 | $39,606 | $4,073 | $35,533 |
| 2016 | $3,220 | $37,015 | $3,807 | $33,208 |
| 2015 | $3,087 | $35,466 | $3,648 | $31,818 |
| 2012 | -- | $41,669 | $4,286 | $37,383 |
Source: Public Records
Map
Nearby Homes
Your Personal Tour Guide
Ask me questions while you tour the home.