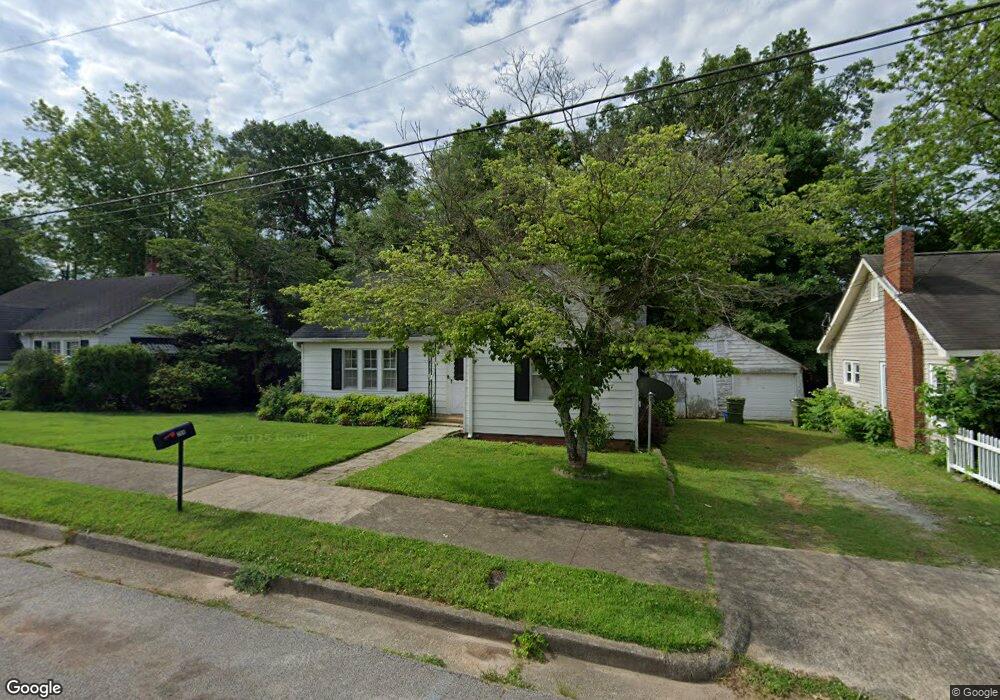
209 E Reese St Carrollton, GA 30117
Estimated Value: $207,399 - $254,000
2
Beds
1
Bath
1,252
Sq Ft
$186/Sq Ft
Est. Value
About This Home
This home is located at 209 E Reese St, Carrollton, GA 30117 and is currently estimated at $233,350, approximately $186 per square foot. 209 E Reese St is a home located in Carroll County with nearby schools including Carrollton Elementary School, Carrollton Upper Elementary School, and Carrollton Middle School.
Ownership History
Date
Name
Owned For
Owner Type
Purchase Details
Closed on
May 21, 2020
Sold by
Glanton Thomas P
Bought by
Glanton Holdings Llc
Current Estimated Value
Purchase Details
Closed on
Jun 20, 2019
Sold by
Carter Norman E
Bought by
Glanton Thomas P and Glanton Rebecca C
Purchase Details
Closed on
Jun 22, 2018
Sold by
Hayden Conrad C
Bought by
Carter Norman E and Carter Sara E
Purchase Details
Closed on
Oct 13, 2017
Bought by
Hayden Conrad C and Hayden Richard C
Purchase Details
Closed on
Feb 29, 2016
Sold by
Crews Lisa Jones
Bought by
Purpleglass Llc
Purchase Details
Closed on
May 23, 2012
Sold by
Jones Betty J
Bought by
Crews Lisa Jones
Purchase Details
Closed on
Apr 17, 2000
Sold by
Jones Jimmy D
Bought by
Jones Betty J
Purchase Details
Closed on
Sep 9, 1992
Bought by
Jones
Create a Home Valuation Report for This Property
The Home Valuation Report is an in-depth analysis detailing your home's value as well as a comparison with similar homes in the area
Home Values in the Area
Average Home Value in this Area
Purchase History
| Date | Buyer | Sale Price | Title Company |
|---|---|---|---|
| Glanton Holdings Llc | -- | -- | |
| Glanton Thomas P | $90,000 | -- | |
| Carter Norman E | $87,900 | -- | |
| Hayden Conrad C | -- | -- | |
| Purpleglass Llc | $65,000 | -- | |
| Crews Lisa Jones | -- | -- | |
| Jones Betty J | -- | -- | |
| Jones | $47,500 | -- |
Source: Public Records
Tax History Compared to Growth
Tax History
| Year | Tax Paid | Tax Assessment Tax Assessment Total Assessment is a certain percentage of the fair market value that is determined by local assessors to be the total taxable value of land and additions on the property. | Land | Improvement |
|---|---|---|---|---|
| 2024 | $1,562 | $57,180 | $13,608 | $43,572 |
| 2023 | $1,562 | $59,968 | $13,608 | $46,360 |
| 2022 | $1,195 | $40,930 | $9,072 | $31,858 |
| 2021 | $997 | $34,171 | $6,720 | $27,451 |
| 2020 | $919 | $31,440 | $6,720 | $24,720 |
| 2019 | $873 | $29,592 | $6,720 | $22,872 |
| 2018 | $810 | $27,080 | $6,720 | $20,360 |
| 2017 | $815 | $27,080 | $6,720 | $20,360 |
| 2016 | $819 | $27,080 | $6,720 | $20,360 |
| 2015 | $614 | $19,863 | $6,000 | $13,864 |
| 2014 | $162 | $20,074 | $6,000 | $14,074 |
Source: Public Records
Map
Nearby Homes
- 110 Town Walk Ln
- 0 Ward St Unit 10390499
- 205 Johnson Ave Unit 231
- 322 Cedar St
- 103 W Chandler St
- 541 N White St Unit 12
- 541 N White St
- 108 Springwood Dr
- 120 Stewart St
- 405 N Park St
- 201 Stewart St
- 777 College St
- TRACT1-7 Us Highway 27
- 301 C4 Bradley St
- 301 Bradley St
- 109 S Park St
- 119 Oxford Square
- 123 Cedar Park Way
- 654 King St
- 27 South St
- 205 E Reese St
- 215 E Reese St
- 319 College St Unit D
- 319 College St
- 319 College St Unit C
- 319 College St Unit A
- 330 N White St
- 330 1 N White St
- 315 College St
- 330 1/2 N White St Unit . A (downstairs)
- 330 1/2 N White St Unit . B (upstairs)
- 330 1/2 N White St
- 322 N White St
- 314 N White St
- 322 College St
- 402 College St
- 325 N White St
- 310 N White St
- 329 N White St
- 316 College St