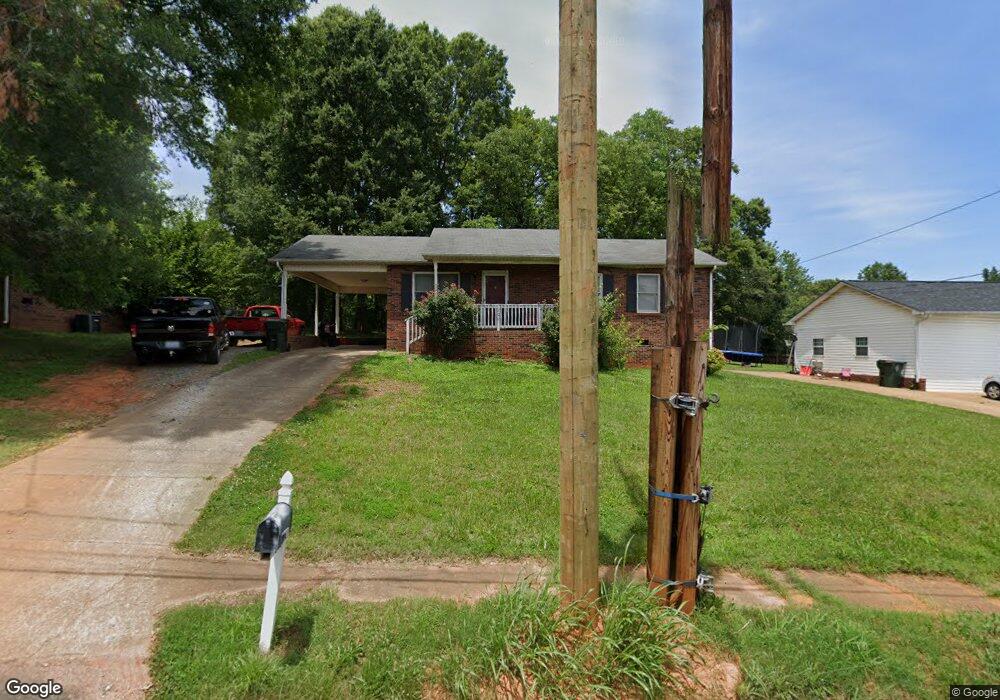
209 E Ridge St Kings Mountain, NC 28086
Estimated Value: $173,000 - $206,000
3
Beds
2
Baths
1,040
Sq Ft
$187/Sq Ft
Est. Value
About This Home
This home is located at 209 E Ridge St, Kings Mountain, NC 28086 and is currently estimated at $194,533, approximately $187 per square foot. 209 E Ridge St is a home located in Cleveland County with nearby schools including North Elementary School, Kings Mountain Middle, and Kings Mountain Intermediate School.
Ownership History
Date
Name
Owned For
Owner Type
Purchase Details
Closed on
Nov 24, 2020
Sold by
Digeronimo James Anthony
Bought by
Digeronimo James A and The James A Digeronimo Revocab
Current Estimated Value
Purchase Details
Closed on
Jun 6, 2013
Sold by
Secretary Of Hud
Bought by
Digeronimo James Anthony
Home Financials for this Owner
Home Financials are based on the most recent Mortgage that was taken out on this home.
Original Mortgage
$57,000
Outstanding Balance
$40,619
Interest Rate
3.53%
Mortgage Type
New Conventional
Estimated Equity
$153,914
Purchase Details
Closed on
Mar 21, 2006
Sold by
Minor Timberly and Minor Carmen
Bought by
Narvaez Rafeal
Home Financials for this Owner
Home Financials are based on the most recent Mortgage that was taken out on this home.
Original Mortgage
$65,200
Interest Rate
7.62%
Mortgage Type
Adjustable Rate Mortgage/ARM
Purchase Details
Closed on
May 24, 2005
Sold by
Minor Tomarice
Bought by
Manor Timothy
Create a Home Valuation Report for This Property
The Home Valuation Report is an in-depth analysis detailing your home's value as well as a comparison with similar homes in the area
Home Values in the Area
Average Home Value in this Area
Purchase History
| Date | Buyer | Sale Price | Title Company |
|---|---|---|---|
| Digeronimo James A | -- | None Available | |
| Digeronimo James Anthony | -- | None Available | |
| Narvaez Rafeal | $81,500 | None Available | |
| Manor Timothy | -- | None Available |
Source: Public Records
Mortgage History
| Date | Status | Borrower | Loan Amount |
|---|---|---|---|
| Open | Digeronimo James Anthony | $57,000 | |
| Previous Owner | Narvaez Rafeal | $65,200 |
Source: Public Records
Tax History Compared to Growth
Tax History
| Year | Tax Paid | Tax Assessment Tax Assessment Total Assessment is a certain percentage of the fair market value that is determined by local assessors to be the total taxable value of land and additions on the property. | Land | Improvement |
|---|---|---|---|---|
| 2025 | $1,782 | $173,824 | $17,325 | $156,499 |
| 2024 | $1,203 | $100,921 | $9,625 | $91,296 |
| 2023 | $1,197 | $100,921 | $9,625 | $91,296 |
| 2022 | $1,147 | $100,921 | $9,625 | $91,296 |
| 2021 | $1,153 | $100,921 | $9,625 | $91,296 |
| 2020 | $849 | $71,915 | $6,545 | $65,370 |
| 2019 | $849 | $71,915 | $6,545 | $65,370 |
| 2018 | $848 | $71,915 | $6,545 | $65,370 |
| 2017 | $844 | $71,915 | $6,545 | $65,370 |
| 2016 | $846 | $71,915 | $6,545 | $65,370 |
| 2015 | $918 | $80,274 | $6,545 | $73,729 |
| 2014 | $918 | $80,274 | $6,545 | $73,729 |
Source: Public Records
Map
Nearby Homes
- 110 N Gaston St
- 308 N Carpenter St
- 311 E King St Unit 2
- 5066 Beargrass Dr
- 405 Clinton Dr
- 403 Cherry St
- 506 E Ridge St
- 207 Morris St
- 200 E Gold St
- 408 Walnut St
- 409 Chestnut St
- 25 Bennett Dr
- 114 Hendricks St
- 116 Walker St
- 109 Fulton St Unit 9
- 110 N Oriental Ave
- 106 N Tracy St
- 309 York Rd
- 310 Campbell Cir
- 316 S Cansler St
- 211 E Ridge St
- 207 E Ridge St
- 203 E Ridge St
- 213 E Ridge St
- 203 N Carpenter St
- 210 E Ridge St
- 212 E Ridge St
- 208 E Ridge St
- 117 N Carpenter St
- 301 E Ridge St
- 301A&B Ridge St
- 300 E Ridge St
- 208 E Parker St Unit 85
- 208 E Parker St
- 113 N Carpenter St
- 210 E Parker St
- 206 N Carpenter St
- 204 E Parker St
- 206 E Parker St
- 212 E Parker St