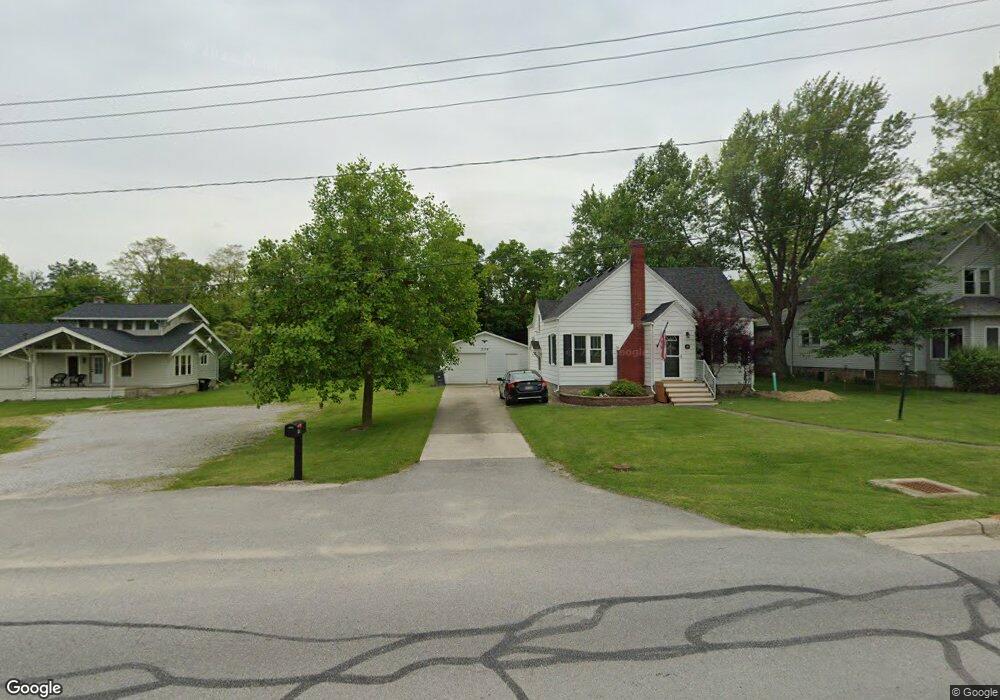
209 E River St Antwerp, OH 45813
Estimated Value: $111,000 - $179,000
3
Beds
1
Bath
1,300
Sq Ft
$113/Sq Ft
Est. Value
About This Home
This home is located at 209 E River St, Antwerp, OH 45813 and is currently estimated at $146,527, approximately $112 per square foot. 209 E River St is a home located in Paulding County with nearby schools including Antwerp Local Elementary School and Antwerp Local High School.
Ownership History
Date
Name
Owned For
Owner Type
Purchase Details
Closed on
Aug 8, 2014
Sold by
Rangel Philip J and Rangel Leah M
Bought by
Zartman Suzanne E
Current Estimated Value
Home Financials for this Owner
Home Financials are based on the most recent Mortgage that was taken out on this home.
Original Mortgage
$70,775
Outstanding Balance
$53,173
Interest Rate
4.11%
Mortgage Type
New Conventional
Estimated Equity
$93,354
Purchase Details
Closed on
Apr 30, 2008
Sold by
Yoder Malinda and Yoder Melvin A
Bought by
Rangel Philip J and Rangel Leah M
Purchase Details
Closed on
Mar 14, 2008
Sold by
Ross Walter G
Bought by
Yoder Malinda and Yoder Melvin A
Purchase Details
Closed on
Jan 26, 2005
Sold by
Estate Of Ruth E Ross
Bought by
Ross Walter G
Create a Home Valuation Report for This Property
The Home Valuation Report is an in-depth analysis detailing your home's value as well as a comparison with similar homes in the area
Purchase History
| Date | Buyer | Sale Price | Title Company |
|---|---|---|---|
| Zartman Suzanne E | -- | None Available | |
| Rangel Philip J | -- | None Available | |
| Yoder Malinda | $59,000 | None Available | |
| Ross Walter G | -- | None Available |
Source: Public Records
Mortgage History
| Date | Status | Borrower | Loan Amount |
|---|---|---|---|
| Open | Zartman Suzanne E | $70,775 |
Source: Public Records
Tax History
| Year | Tax Paid | Tax Assessment Tax Assessment Total Assessment is a certain percentage of the fair market value that is determined by local assessors to be the total taxable value of land and additions on the property. | Land | Improvement |
|---|---|---|---|---|
| 2025 | $1,944 | $48,690 | $8,540 | $40,150 |
| 2024 | $1,944 | $32,910 | $5,780 | $27,130 |
| 2023 | $1,462 | $32,910 | $5,780 | $27,130 |
| 2022 | $1,324 | $32,910 | $5,780 | $27,130 |
| 2021 | $1,222 | $27,130 | $5,320 | $21,810 |
| 2020 | $1,250 | $27,130 | $5,320 | $21,810 |
| 2019 | $1,264 | $25,130 | $5,320 | $19,810 |
| 2018 | $1,176 | $25,130 | $5,320 | $19,810 |
| 2017 | $1,177 | $25,130 | $5,320 | $19,810 |
| 2016 | $1,177 | $25,130 | $5,320 | $19,810 |
| 2015 | $1,029 | $22,060 | $4,870 | $17,190 |
| 2014 | $963 | $22,060 | $4,870 | $17,190 |
| 2013 | $1,054 | $22,060 | $4,870 | $17,190 |
Source: Public Records
Map
Nearby Homes
- 106 High St
- 314 E Canal St
- 214 Weber St
- 212 Weber St
- 210 Weber St
- 106 Buffalo St
- 136 Maumee Ln
- 4337 Road 162
- 13149 Road 27b
- 3190 Road 204
- 1258 Road 192
- 16453 Road 63
- 4787 Carson Ct
- 18987 County Road 15
- 26100 Worden Rd
- 4616 Homestead Trail
- 11051 Road 93
- 5038 Chickadee Dr
- 4974 Chickadee Dr
- 4220 Oak St
Your Personal Tour Guide
Ask me questions while you tour the home.