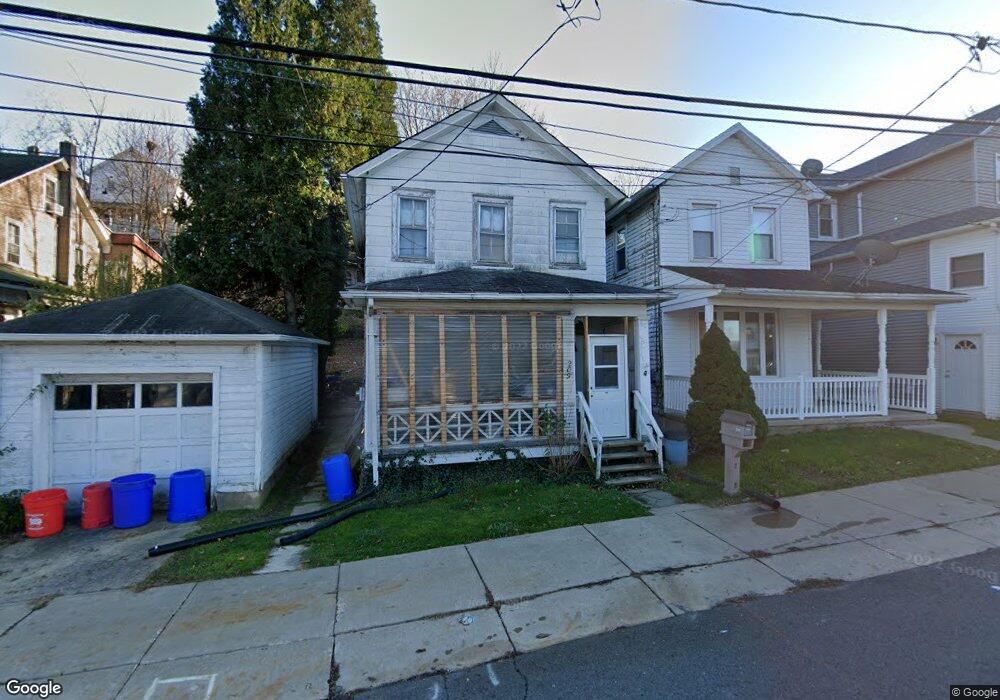
209 E Spring St Nanticoke, PA 18634
Estimated Value: $82,000 - $135,000
3
Beds
1
Bath
1,332
Sq Ft
$87/Sq Ft
Est. Value
About This Home
This home is located at 209 E Spring St, Nanticoke, PA 18634 and is currently estimated at $115,806, approximately $86 per square foot. 209 E Spring St is a home located in Luzerne County with nearby schools including Kennedy Early Childhood Center, Nanticoke Area Elementary Center Center, and Greater Nanticoke Area Senior High School.
Ownership History
Date
Name
Owned For
Owner Type
Purchase Details
Closed on
May 25, 2016
Sold by
Sugar Notch Homes Llc
Bought by
Turner Joni J
Current Estimated Value
Purchase Details
Closed on
May 15, 2014
Sold by
Mid Atlantic Acquisitions Inc
Bought by
Sugar Notch Homes Llc
Home Financials for this Owner
Home Financials are based on the most recent Mortgage that was taken out on this home.
Original Mortgage
$15,000
Interest Rate
4.42%
Mortgage Type
Purchase Money Mortgage
Purchase Details
Closed on
Jan 10, 2012
Sold by
Pfunter Grace R
Bought by
Mid Atlantic Acquisitions Inc
Create a Home Valuation Report for This Property
The Home Valuation Report is an in-depth analysis detailing your home's value as well as a comparison with similar homes in the area
Home Values in the Area
Average Home Value in this Area
Purchase History
| Date | Buyer | Sale Price | Title Company |
|---|---|---|---|
| Turner Joni J | $25,000 | None Available | |
| Sugar Notch Homes Llc | $11,000 | First American Title Ins Co | |
| Mid Atlantic Acquisitions Inc | $4,420 | None Available |
Source: Public Records
Mortgage History
| Date | Status | Borrower | Loan Amount |
|---|---|---|---|
| Previous Owner | Sugar Notch Homes Llc | $15,000 |
Source: Public Records
Tax History
| Year | Tax Paid | Tax Assessment Tax Assessment Total Assessment is a certain percentage of the fair market value that is determined by local assessors to be the total taxable value of land and additions on the property. | Land | Improvement |
|---|---|---|---|---|
| 2026 | $616 | $32,000 | $19,700 | $12,300 |
| 2025 | $835 | $32,000 | $19,700 | $12,300 |
| 2024 | $835 | $32,000 | $19,700 | $12,300 |
| 2023 | $823 | $32,000 | $19,700 | $12,300 |
| 2022 | $785 | $32,000 | $19,700 | $12,300 |
| 2021 | $768 | $32,000 | $19,700 | $12,300 |
| 2020 | $768 | $32,000 | $19,700 | $12,300 |
| 2019 | $762 | $32,000 | $19,700 | $12,300 |
| 2018 | $749 | $32,000 | $19,700 | $12,300 |
| 2017 | $735 | $32,000 | $19,700 | $12,300 |
| 2016 | $354 | $32,000 | $19,700 | $12,300 |
| 2015 | $788 | $32,000 | $19,700 | $12,300 |
| 2014 | $788 | $32,000 | $19,700 | $12,300 |
Source: Public Records
Map
Nearby Homes
- 22 S Walnut St
- 20 Locust St
- 2B Railroad St
- 284 E Grand St
- 711 S Hanover St
- 416 E Washington St
- 25 W Grove St
- 24 Varsity Dr
- 23 Varsity Dr
- 22 Varsity Dr
- 21 Brian Place
- 20 Brian Place
- 1045 Lincoln Ave
- 1201 S Hanover St
- 205 Garfield St
- 99 W Main St
- 35 Minden Ct
- Lot 55 Vista Dr
- Lot 45 Vista Dr
- Lot 47 Vista Dr
Your Personal Tour Guide
Ask me questions while you tour the home.