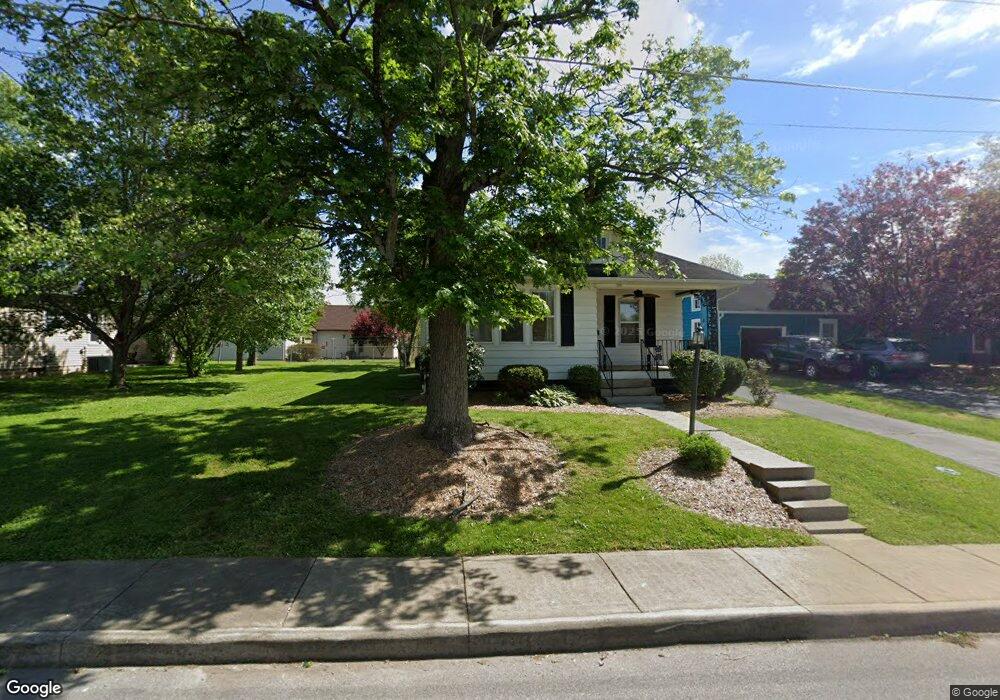
209 Elliott Ave Corydon, IN 47112
Estimated Value: $174,000 - $194,000
3
Beds
1
Bath
1,254
Sq Ft
$148/Sq Ft
Est. Value
About This Home
This home is located at 209 Elliott Ave, Corydon, IN 47112 and is currently estimated at $185,419, approximately $147 per square foot. 209 Elliott Ave is a home located in Harrison County with nearby schools including Corydon Elementary School, Corydon Intermediate School, and Corydon Central Junior High School.
Ownership History
Date
Name
Owned For
Owner Type
Purchase Details
Closed on
Dec 28, 2021
Sold by
Bds Of Corydon Llc
Bought by
Kea Properties Of Corydon Llc
Current Estimated Value
Purchase Details
Closed on
Jul 22, 2021
Sold by
Joanna Walter
Bought by
Bds Of Corydon Llc
Home Financials for this Owner
Home Financials are based on the most recent Mortgage that was taken out on this home.
Interest Rate
2.78%
Purchase Details
Closed on
Mar 19, 2018
Sold by
Crosier E
Bought by
Joann Walter
Create a Home Valuation Report for This Property
The Home Valuation Report is an in-depth analysis detailing your home's value as well as a comparison with similar homes in the area
Home Values in the Area
Average Home Value in this Area
Purchase History
| Date | Buyer | Sale Price | Title Company |
|---|---|---|---|
| Kea Properties Of Corydon Llc | $122,000 | Davis Davis & Layson | |
| Bds Of Corydon Llc | $90,000 | -- | |
| Joann Walter | $78,000 | -- |
Source: Public Records
Mortgage History
| Date | Status | Borrower | Loan Amount |
|---|---|---|---|
| Previous Owner | Bds Of Corydon Llc | -- |
Source: Public Records
Tax History Compared to Growth
Tax History
| Year | Tax Paid | Tax Assessment Tax Assessment Total Assessment is a certain percentage of the fair market value that is determined by local assessors to be the total taxable value of land and additions on the property. | Land | Improvement |
|---|---|---|---|---|
| 2024 | $2,427 | $142,800 | $21,500 | $121,300 |
| 2023 | $2,233 | $126,300 | $20,500 | $105,800 |
| 2022 | $2,136 | $118,900 | $18,200 | $100,700 |
| 2021 | $297 | $71,200 | $9,100 | $62,100 |
| 2020 | $295 | $70,000 | $9,100 | $60,900 |
| 2019 | $297 | $68,200 | $9,100 | $59,100 |
| 2018 | $277 | $64,800 | $9,100 | $55,700 |
| 2017 | $1,278 | $64,900 | $9,100 | $55,800 |
| 2016 | $1,145 | $64,200 | $9,100 | $55,100 |
| 2014 | $1,092 | $64,600 | $9,100 | $55,500 |
| 2013 | $1,092 | $62,700 | $9,100 | $53,600 |
Source: Public Records
Map
Nearby Homes
- 609 Farquar Ave
- 601 Farquar Ave
- 524 N Capitol Ave
- 807 Woodland Ave
- 300 N Maple St
- 813 Woodland Ave
- 0 Atwood St Unit 2025012067
- 104 Cook St
- 1335 Grace St NE
- 895 Brigetta Dr NE
- 0 N Highway 337 NE
- 0 N Highway 337
- The Paislee Plan at Poplar Trace
- The Eleanor Plan at Poplar Trace
- The Bedford Plan at Poplar Trace
- The Ivy Plan at Poplar Trace
- The Harrison Plan at Poplar Trace
- 1557 Cypress Cove NW
- 1555 Cypress Cove NW
- 1052 Poplar Trace Way
- 215 Elliott Ave
- 615 N Mulberry St
- 624 Farquar Ave
- 216 Elliott Ave
- 206 Elliott Ave
- 616 Farquar Ave
- 202 Elliott Ave
- 222 Elliott Ave
- 228 Elliott Ave
- 611 N Mulberry St
- 620 N Mulberry St
- 117 Elliott Ave
- 624 N Mulberry St
- 628 N Mulberry St
- 226 Elliott Ave
- 610 Farquar Ave
- 613 Farquar Ave
- 708 Farquar Ave
- 605 N Mulberry St
- 614 N Mulberry St