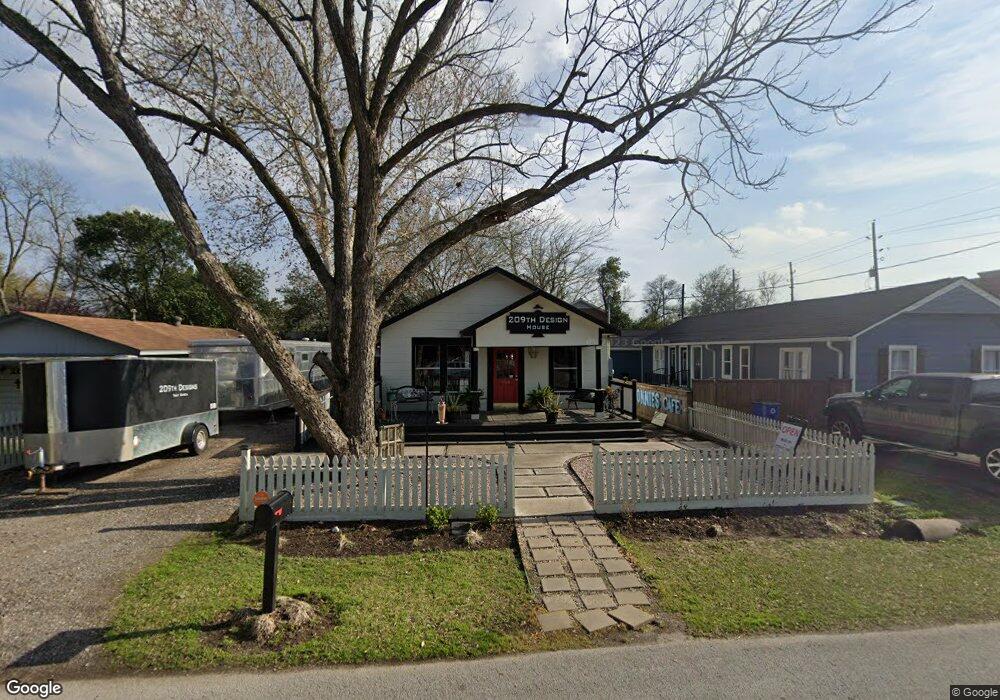
209 Fannin St Tomball, TX 77375
Estimated Value: $219,602 - $284,000
2
Beds
1
Bath
825
Sq Ft
$291/Sq Ft
Est. Value
About This Home
This home is located at 209 Fannin St, Tomball, TX 77375 and is currently estimated at $239,901, approximately $290 per square foot. 209 Fannin St is a home located in Harris County with nearby schools including Tomball Elementary School, Tomball Intermediate School, and Tomball Junior High School.
Ownership History
Date
Name
Owned For
Owner Type
Purchase Details
Closed on
Jun 16, 2025
Sold by
Garza Troy and Naylor Kim
Bought by
F & D Landing Llc
Current Estimated Value
Purchase Details
Closed on
Jul 10, 2008
Sold by
Naylor Kim
Bought by
Naylor Kim and Garza Troy
Home Financials for this Owner
Home Financials are based on the most recent Mortgage that was taken out on this home.
Original Mortgage
$101,500
Interest Rate
5.83%
Mortgage Type
New Conventional
Create a Home Valuation Report for This Property
The Home Valuation Report is an in-depth analysis detailing your home's value as well as a comparison with similar homes in the area
Home Values in the Area
Average Home Value in this Area
Purchase History
| Date | Buyer | Sale Price | Title Company |
|---|---|---|---|
| F & D Landing Llc | -- | None Listed On Document | |
| Naylor Kim | -- | None Available |
Source: Public Records
Mortgage History
| Date | Status | Borrower | Loan Amount |
|---|---|---|---|
| Previous Owner | Naylor Kim | $101,500 |
Source: Public Records
Tax History Compared to Growth
Tax History
| Year | Tax Paid | Tax Assessment Tax Assessment Total Assessment is a certain percentage of the fair market value that is determined by local assessors to be the total taxable value of land and additions on the property. | Land | Improvement |
|---|---|---|---|---|
| 2025 | $4,454 | $198,383 | $96,750 | $101,633 |
| 2024 | $4,454 | $201,250 | $90,300 | $110,950 |
| 2023 | $4,454 | $183,689 | $77,400 | $106,289 |
| 2022 | $3,360 | $149,079 | $58,050 | $91,029 |
| 2021 | $2,637 | $111,180 | $41,925 | $69,255 |
| 2020 | $2,506 | $102,184 | $32,250 | $69,934 |
| 2019 | $2,244 | $88,969 | $25,800 | $63,169 |
| 2018 | $969 | $72,319 | $25,800 | $46,519 |
| 2017 | $1,763 | $69,951 | $25,800 | $44,151 |
| 2016 | $1,665 | $66,074 | $25,800 | $40,274 |
| 2015 | $1,530 | $63,918 | $25,800 | $38,118 |
| 2014 | $1,530 | $60,087 | $25,800 | $34,287 |
Source: Public Records
Map
Nearby Homes
- 20734 Open Range Ct
- 18818 Cornelia Fields Ln
- 18723 Buttercup Farms Ln
- 20718 Open Range Ct
- 19951 Epona Creek Dr
- 19935 Epona Creek Dr
- 18707 Buttercup Farms Ln
- 18826 Cornelia Fields Ln
- 20714 Open Range Ct
- 109 Mcphail St
- 504 Percival St Unit A
- 505 Percival St
- 0 N Sycamore St
- 516 Clayton St
- TBD Clayton St
- 315 Mechanic St
- 306 E Main St
- TBD Mechanic St
- lt 19 Mechanic Rd
- 0 Holiday St