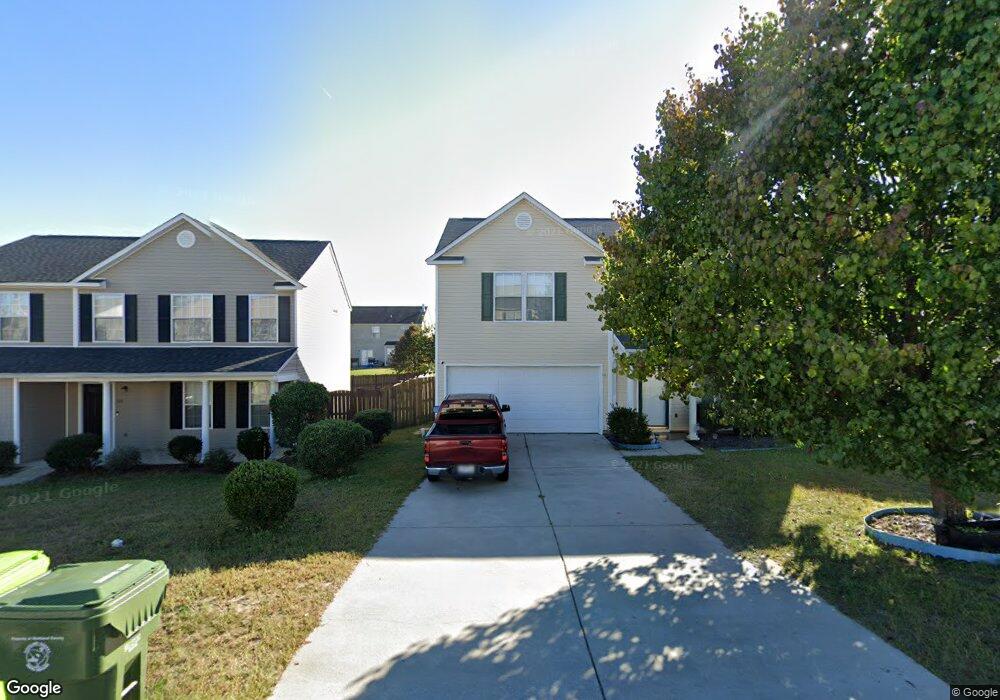
209 Fox Grove Cir Columbia, SC 29229
Northeast Columbia NeighborhoodEstimated Value: $230,922 - $263,000
4
Beds
3
Baths
2,072
Sq Ft
$119/Sq Ft
Est. Value
About This Home
This home is located at 209 Fox Grove Cir, Columbia, SC 29229 and is currently estimated at $246,731, approximately $119 per square foot. 209 Fox Grove Cir is a home located in Richland County with nearby schools including Kelly Mill Middle School and Ridge View High School.
Ownership History
Date
Name
Owned For
Owner Type
Purchase Details
Closed on
Mar 10, 2025
Sold by
Fluellen Roderick M
Bought by
R & D Elite Properties Llc
Current Estimated Value
Purchase Details
Closed on
Oct 17, 2016
Sold by
Spann Derrick M and Spann Derrick
Bought by
Fluellen Roderick M
Home Financials for this Owner
Home Financials are based on the most recent Mortgage that was taken out on this home.
Original Mortgage
$119,298
Interest Rate
4.12%
Mortgage Type
FHA
Purchase Details
Closed on
Oct 30, 2009
Sold by
Gilmore Takeisha
Bought by
Spann Derrick
Purchase Details
Closed on
Nov 18, 2004
Sold by
Firstar Homes Inc
Bought by
Spann Derrick M and Gilmore Takeisha
Home Financials for this Owner
Home Financials are based on the most recent Mortgage that was taken out on this home.
Original Mortgage
$122,035
Interest Rate
5.77%
Mortgage Type
FHA
Create a Home Valuation Report for This Property
The Home Valuation Report is an in-depth analysis detailing your home's value as well as a comparison with similar homes in the area
Home Values in the Area
Average Home Value in this Area
Purchase History
| Date | Buyer | Sale Price | Title Company |
|---|---|---|---|
| R & D Elite Properties Llc | -- | None Listed On Document | |
| Fluellen Roderick M | $121,500 | None Available | |
| Spann Derrick | -- | -- | |
| Spann Derrick M | $123,000 | -- |
Source: Public Records
Mortgage History
| Date | Status | Borrower | Loan Amount |
|---|---|---|---|
| Previous Owner | Fluellen Roderick M | $119,298 | |
| Previous Owner | Spann Derrick M | $122,035 |
Source: Public Records
Tax History Compared to Growth
Tax History
| Year | Tax Paid | Tax Assessment Tax Assessment Total Assessment is a certain percentage of the fair market value that is determined by local assessors to be the total taxable value of land and additions on the property. | Land | Improvement |
|---|---|---|---|---|
| 2024 | $1,510 | $141,400 | $0 | $0 |
| 2023 | $1,510 | $4,916 | $0 | $0 |
| 2022 | $1,357 | $122,900 | $19,000 | $103,900 |
| 2021 | $1,098 | $3,700 | $0 | $0 |
| 2020 | $1,372 | $4,920 | $0 | $0 |
| 2019 | $1,347 | $4,920 | $0 | $0 |
| 2018 | $1,327 | $4,860 | $0 | $0 |
| 2017 | $1,303 | $4,860 | $0 | $0 |
| 2016 | $1,005 | $3,500 | $0 | $0 |
| 2015 | $1,008 | $3,500 | $0 | $0 |
| 2014 | $1,006 | $87,400 | $0 | $0 |
| 2013 | -- | $3,500 | $0 | $0 |
Source: Public Records
Map
Nearby Homes
- 201 Fox Grove Cir
- 193 Fox Grove Cir
- 233 Fox Grove Cir
- 478 Fox Trot Dr
- 253 Fox Grove Cir
- 387 Legend Oaks Dr
- 382 Fox Trot Dr
- 301 Legend Oaks Dr
- 449 Legend Oaks Dr
- 208 Bentwood Ln
- 405 Spring Oak Ln
- 1608 Summit Ridge Dr
- 525 Woodlock Ln
- 300 White Gables Dr
- 431 Dahoon Dr
- 113 Chapelwood Dr
- 402 Hidden Pines Rd
- 201 Denby Cir
- 206 Denby Cir
- 3 Fonthill Ct
- 205 Fox Grove Cir
- 213 Fox Grove Cir
- 217 Fox Grove Cir
- 212 Fox Grove Cir
- 204 Fox Grove Cir
- 216 Fox Grove Cir
- 221 Fox Grove Cir
- 200 Fox Grove Cir
- 557 Fox Haven Dr
- 197 Fox Grove Cir
- 561 Fox Haven Dr
- 565 Fox Haven Dr
- 553 Fox Haven Dr
- 220 Fox Grove Cir
- 194 Fox Grove Cir
- 549 Fox Haven Dr
- 225 Fox Grove Cir
- 569 Fox Haven Dr
- 228 Fox Grove Cir
- 545 Fox Haven Dr