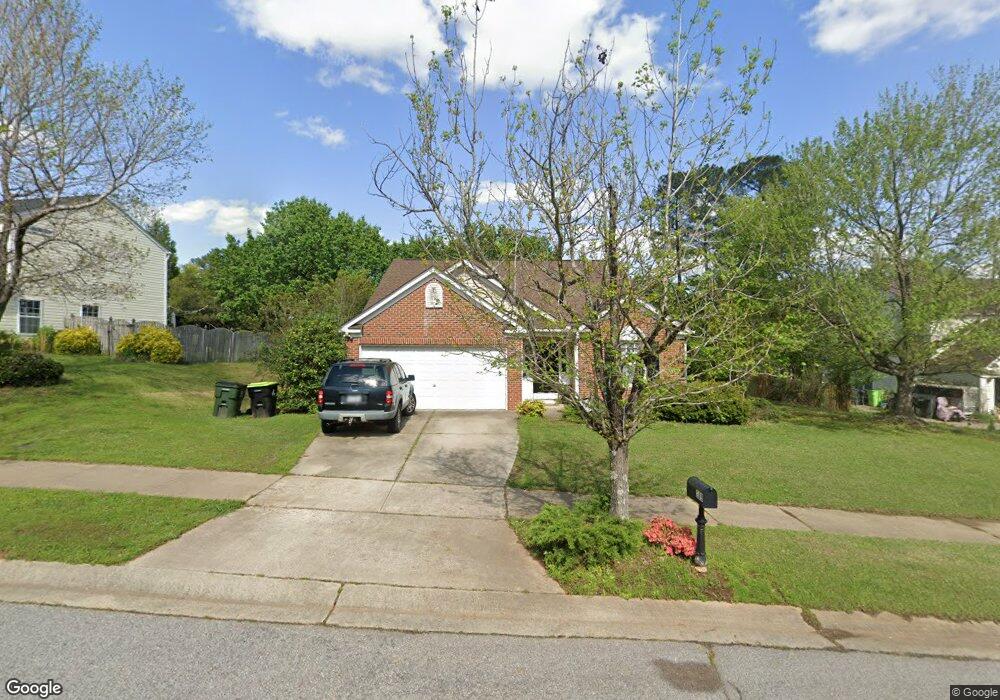
209 Hartshorn Ct Holly Springs, NC 27540
Estimated Value: $390,000 - $395,000
3
Beds
2
Baths
1,560
Sq Ft
$252/Sq Ft
Est. Value
About This Home
This home is located at 209 Hartshorn Ct, Holly Springs, NC 27540 and is currently estimated at $393,044, approximately $251 per square foot. 209 Hartshorn Ct is a home located in Wake County with nearby schools including Oakview Elementary School, Apex Friendship Middle School, and Holly Springs High School.
Ownership History
Date
Name
Owned For
Owner Type
Purchase Details
Closed on
Apr 26, 2017
Sold by
Krause Thomas Jean and Krause Bobbi Jean
Bought by
Patel Varshal
Current Estimated Value
Home Financials for this Owner
Home Financials are based on the most recent Mortgage that was taken out on this home.
Original Mortgage
$150,000
Outstanding Balance
$76,414
Interest Rate
3.5%
Mortgage Type
New Conventional
Estimated Equity
$316,630
Purchase Details
Closed on
Mar 24, 2009
Sold by
Marley Travis L and Marley Melanie L
Bought by
Krause Thomas Jean and Krause Bobbi Jean
Home Financials for this Owner
Home Financials are based on the most recent Mortgage that was taken out on this home.
Original Mortgage
$176,641
Interest Rate
5.13%
Mortgage Type
FHA
Purchase Details
Closed on
Mar 2, 2001
Sold by
Colony Homes Llc
Bought by
Marley Travis L and Marley Melanie Y
Home Financials for this Owner
Home Financials are based on the most recent Mortgage that was taken out on this home.
Original Mortgage
$142,538
Interest Rate
7.06%
Mortgage Type
FHA
Create a Home Valuation Report for This Property
The Home Valuation Report is an in-depth analysis detailing your home's value as well as a comparison with similar homes in the area
Home Values in the Area
Average Home Value in this Area
Purchase History
| Date | Buyer | Sale Price | Title Company |
|---|---|---|---|
| Patel Varshal | $230,000 | None Available | |
| Krause Thomas Jean | $180,000 | None Available | |
| Marley Travis L | $145,000 | -- |
Source: Public Records
Mortgage History
| Date | Status | Borrower | Loan Amount |
|---|---|---|---|
| Open | Patel Varshal | $150,000 | |
| Previous Owner | Krause Thomas Jean | $176,641 | |
| Previous Owner | Marley Travis L | $142,538 |
Source: Public Records
Tax History Compared to Growth
Tax History
| Year | Tax Paid | Tax Assessment Tax Assessment Total Assessment is a certain percentage of the fair market value that is determined by local assessors to be the total taxable value of land and additions on the property. | Land | Improvement |
|---|---|---|---|---|
| 2025 | $3,193 | $368,734 | $120,000 | $248,734 |
| 2024 | $3,180 | $368,734 | $120,000 | $248,734 |
| 2023 | $2,664 | $245,113 | $65,000 | $180,113 |
| 2022 | $2,572 | $245,113 | $65,000 | $180,113 |
| 2021 | $2,524 | $245,113 | $65,000 | $180,113 |
| 2020 | $2,524 | $245,113 | $65,000 | $180,113 |
| 2019 | $2,346 | $193,329 | $55,000 | $138,329 |
| 2018 | $2,121 | $193,329 | $55,000 | $138,329 |
| 2017 | $2,045 | $193,329 | $55,000 | $138,329 |
| 2016 | $2,017 | $193,329 | $55,000 | $138,329 |
| 2015 | $1,890 | $178,172 | $45,000 | $133,172 |
| 2014 | $1,825 | $178,172 | $45,000 | $133,172 |
Source: Public Records
Map
Nearby Homes
- 224 Hartshorn Ct
- 126 Tuska Hills Dr
- 104 Chilmark Ridge Dr
- 321 Cross Hill Ln
- 105 Cross Hill Ln
- 225 Douglas St
- 737 W Holly Springs Rd
- 405 W Ballentine St
- 743 W Holly Springs Rd
- 749 W Holly Springs Rd
- 755 W Holly Springs Rd
- 124 Cliffdale Rd
- 761 W Holly Springs Rd
- 112 Burt St
- 108 Crabwall Ct
- 100 Sire Ct
- 1205 Trotter Bluffs Dr
- 321 Blalock St
- 220 Avent Ferry Rd
- 305 Martingale Dr
- 205 Hartshorn Ct
- 213 Hartshorn Ct
- 105 Walehurst Ridge Dr
- 217 Hartshorn Ct
- 104 Beverstone Dr
- 100 Beverstone Dr
- 221 Hartshorn Ct
- 220 Hartshorn Ct
- 216 Hartshorn Ct
- 200 Beverstone Dr
- 108 Tetteridge Ct
- 212 Hartshorn Ct
- 228 Hartshorn Ct
- 204 Beverstone Dr
- 208 Hartshorn Ct
- 300 Beverstone Dr
- 204 Hartshorn Ct
- 304 Beverstone Dr
- 504 Sturminster Dr
- 308 Beverstone Dr