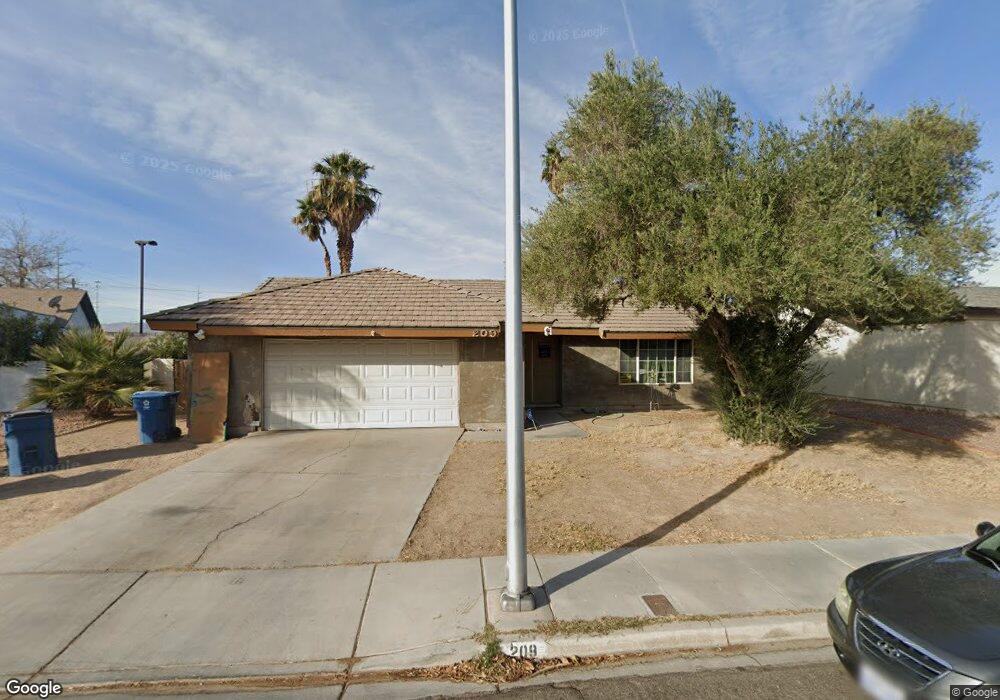
209 Horn St Las Vegas, NV 89107
Twin Lakes NeighborhoodEstimated Value: $365,000 - $446,000
4
Beds
2
Baths
1,832
Sq Ft
$218/Sq Ft
Est. Value
About This Home
This home is located at 209 Horn St, Las Vegas, NV 89107 and is currently estimated at $399,634, approximately $218 per square foot. 209 Horn St is a home located in Clark County with nearby schools including E.W. Griffith Elementary School, Robert O Gibson Middle School, and Western High School.
Ownership History
Date
Name
Owned For
Owner Type
Purchase Details
Closed on
Feb 14, 2011
Sold by
Ruiz Michael J and Ruiz Consuelo
Bought by
Ruiz Michael J
Current Estimated Value
Purchase Details
Closed on
Oct 13, 1999
Sold by
Hud
Bought by
Ruiz Michael J and Ruiz Consuelo
Home Financials for this Owner
Home Financials are based on the most recent Mortgage that was taken out on this home.
Original Mortgage
$116,820
Interest Rate
7.82%
Mortgage Type
FHA
Purchase Details
Closed on
Sep 9, 1999
Sold by
Countrywide Home Loans Inc
Bought by
Hud
Home Financials for this Owner
Home Financials are based on the most recent Mortgage that was taken out on this home.
Original Mortgage
$116,820
Interest Rate
7.82%
Mortgage Type
FHA
Purchase Details
Closed on
Mar 29, 1994
Sold by
Gersky Joseph E and Gersky Joyce M
Bought by
Reynolds Jeffrey R and Reynolds Vicky
Home Financials for this Owner
Home Financials are based on the most recent Mortgage that was taken out on this home.
Original Mortgage
$107,841
Interest Rate
7.15%
Mortgage Type
FHA
Create a Home Valuation Report for This Property
The Home Valuation Report is an in-depth analysis detailing your home's value as well as a comparison with similar homes in the area
Home Values in the Area
Average Home Value in this Area
Purchase History
| Date | Buyer | Sale Price | Title Company |
|---|---|---|---|
| Ruiz Michael J | -- | None Available | |
| Ruiz Michael J | $112,000 | Stewart Title | |
| Hud | -- | First American Title Co | |
| Countrywide Home Loans Inc | $114,295 | First American Title Co | |
| Reynolds Jeffrey R | $108,000 | United Title |
Source: Public Records
Mortgage History
| Date | Status | Borrower | Loan Amount |
|---|---|---|---|
| Previous Owner | Ruiz Michael J | $116,820 | |
| Previous Owner | Reynolds Jeffrey R | $107,841 |
Source: Public Records
Tax History Compared to Growth
Tax History
| Year | Tax Paid | Tax Assessment Tax Assessment Total Assessment is a certain percentage of the fair market value that is determined by local assessors to be the total taxable value of land and additions on the property. | Land | Improvement |
|---|---|---|---|---|
| 2025 | $1,764 | $65,172 | $32,200 | $32,972 |
| 2024 | $1,713 | $65,172 | $32,200 | $32,972 |
| 2023 | $1,713 | $63,623 | $33,950 | $29,673 |
| 2022 | $1,823 | $58,296 | $30,100 | $28,196 |
| 2021 | $1,689 | $53,273 | $25,550 | $27,723 |
| 2020 | $1,565 | $53,193 | $24,850 | $28,343 |
| 2019 | $1,467 | $50,096 | $21,350 | $28,746 |
| 2018 | $1,400 | $45,927 | $17,500 | $28,427 |
| 2017 | $1,543 | $47,066 | $17,500 | $29,566 |
| 2016 | $1,311 | $44,166 | $13,300 | $30,866 |
| 2015 | $1,307 | $40,218 | $9,100 | $31,118 |
| 2014 | $1,267 | $37,492 | $5,950 | $31,542 |
Source: Public Records
Map
Nearby Homes
- 309 Estella Ave
- 312 Estella Ave
- 4317 Hanford Ave
- 4301 Fortune Ave
- 4901 Nebraska Ave
- 324 Princeton St
- 104 Stanford St
- 4404 Mayflower Ln
- 605 N Yale St
- 4504 Nolan Ln
- 424 Stanford St
- 304 N Minnesota St
- 800 Langtry Dr
- 821 Mar Jay Ct
- 504 N Minnesota St
- 605 Stanford St
- 604 N Minnesota St
- 5117 Arbor Way
- 5220 Mission Carmel Ln Unit 103
- 5220 Mission Carmel Ln Unit 107