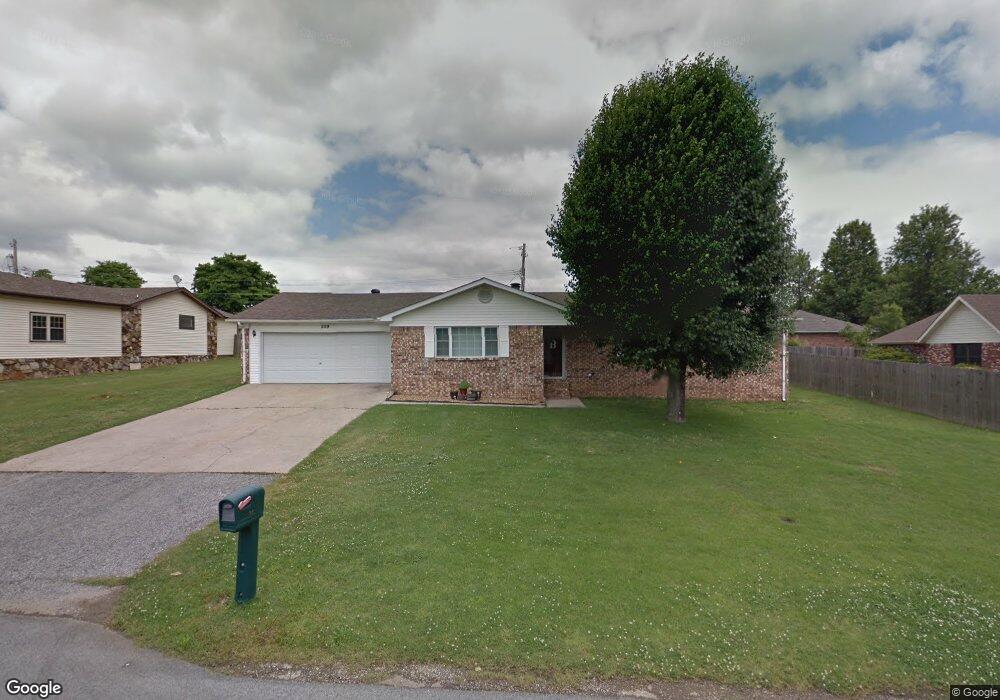
209 Keasler Dr Paragould, AR 72450
Estimated Value: $193,599 - $220,000
--
Bed
2
Baths
1,791
Sq Ft
$115/Sq Ft
Est. Value
About This Home
This home is located at 209 Keasler Dr, Paragould, AR 72450 and is currently estimated at $205,900, approximately $114 per square foot. 209 Keasler Dr is a home located in Greene County with nearby schools including Greene County Tech Primary School, Greene County Tech Elementary School, and Greene County Tech Intermediate School.
Ownership History
Date
Name
Owned For
Owner Type
Purchase Details
Closed on
Feb 27, 2012
Sold by
Ball Vance J and Ball Brittney L
Bought by
Ball Vance J and Ball Brittney L
Current Estimated Value
Home Financials for this Owner
Home Financials are based on the most recent Mortgage that was taken out on this home.
Original Mortgage
$85,000
Outstanding Balance
$9,810
Interest Rate
4.05%
Mortgage Type
New Conventional
Estimated Equity
$196,090
Purchase Details
Closed on
Nov 15, 2002
Bought by
Vance J Ball
Purchase Details
Closed on
Mar 5, 1997
Bought by
Belinda K Cate
Purchase Details
Closed on
May 28, 1993
Bought by
Phillip and Kay Cate
Purchase Details
Closed on
Feb 15, 1983
Bought by
Iretha Larr Y and Iretha Holcomb
Purchase Details
Closed on
Feb 14, 1983
Bought by
Larry and Iretha Holcomb
Create a Home Valuation Report for This Property
The Home Valuation Report is an in-depth analysis detailing your home's value as well as a comparison with similar homes in the area
Home Values in the Area
Average Home Value in this Area
Purchase History
| Date | Buyer | Sale Price | Title Company |
|---|---|---|---|
| Ball Vance J | -- | None Available | |
| Vance J Ball | $76,000 | -- | |
| Belinda K Cate | -- | -- | |
| Phillip | -- | -- | |
| Iretha Larr Y | $55,000 | -- | |
| Larry | -- | -- |
Source: Public Records
Mortgage History
| Date | Status | Borrower | Loan Amount |
|---|---|---|---|
| Open | Ball Vance J | $85,000 |
Source: Public Records
Tax History Compared to Growth
Tax History
| Year | Tax Paid | Tax Assessment Tax Assessment Total Assessment is a certain percentage of the fair market value that is determined by local assessors to be the total taxable value of land and additions on the property. | Land | Improvement |
|---|---|---|---|---|
| 2025 | $1,409 | $33,240 | $5,000 | $28,240 |
| 2024 | $1,345 | $33,240 | $5,000 | $28,240 |
| 2023 | $1,264 | $27,910 | $5,000 | $22,910 |
| 2022 | $889 | $27,910 | $5,000 | $22,910 |
| 2021 | $831 | $27,910 | $5,000 | $22,910 |
| 2020 | $1,149 | $25,040 | $5,000 | $20,040 |
| 2019 | $734 | $25,040 | $5,000 | $20,040 |
| 2018 | $713 | $25,040 | $5,000 | $20,040 |
| 2017 | $985 | $25,040 | $5,000 | $20,040 |
| 2016 | $591 | $25,040 | $5,000 | $20,040 |
| 2015 | $902 | $20,130 | $5,000 | $15,130 |
| 2014 | $902 | $20,130 | $5,000 | $15,130 |
Source: Public Records
Map
Nearby Homes
- 217 S Center Hill Rd
- 4214 W Kingshighway
- 4711 Wise St
- 4802 Wise St
- 4405 Glen Echo Dr
- 606 S Rockingchair Rd
- 3710 W Kingshighway
- 4908 W Kingshighway
- 4105 Cedar Valley Dr
- 601 N Center Hill Rd
- 508 Cindy St
- 609 Marion St
- 3701 Phillips Dr
- 608 Marion St
- 202 Foxfire Dr
- 210 Tech St
- 402 Bellwood Dr
- 700 Cedar Ridge Rd
- 7003 Lockwood Dr
- 4403 Prince Dr
- 212 S Center Hill Rd
- 212 Keasler Dr
- 4401 Prince Dr
- 210 Keasler Dr
- 208 Keasler Dr
- 214 Keasler Dr
- 205 Keasler Dr
- 4402 Prince Dr
- 201 Keasler Dr
- 4404 Prince Dr
- 4503 Prince Dr
- 213 S Center Hill Rd
- 4400 Prince Dr
- 0 Keasler
- 303 Tracy Ln
- 301 S Center Hill Rd
- 4500 Prince Dr
- 209 S Center Hill Rd