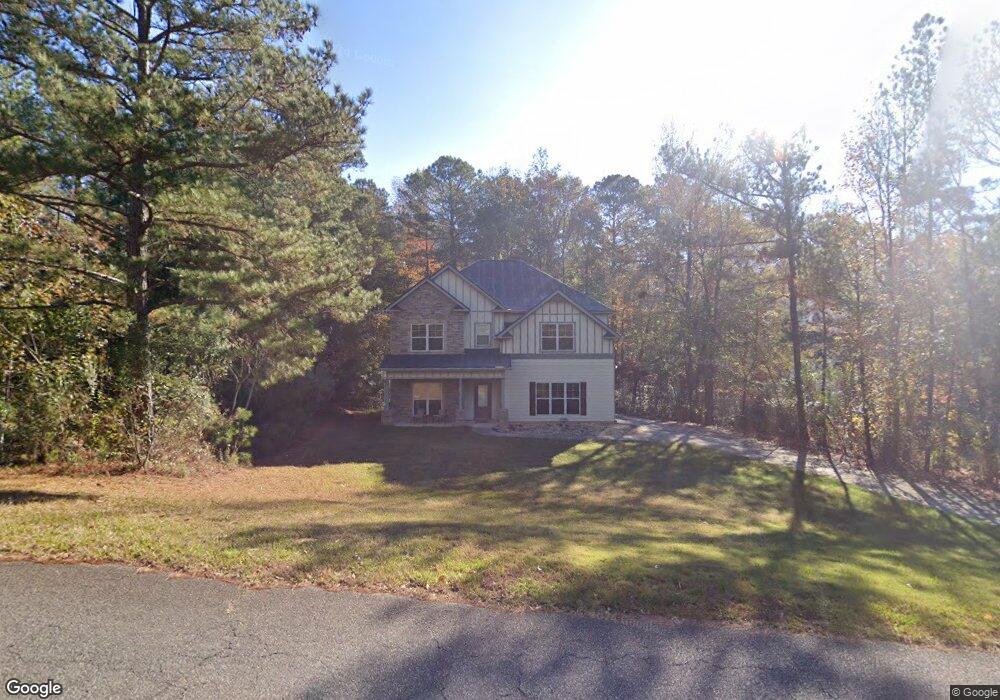
209 Laurel Ridge Ln Cataula, GA 31804
Cataula NeighborhoodEstimated Value: $302,000 - $397,000
3
Beds
3
Baths
2,334
Sq Ft
$152/Sq Ft
Est. Value
About This Home
This home is located at 209 Laurel Ridge Ln, Cataula, GA 31804 and is currently estimated at $355,079, approximately $152 per square foot. 209 Laurel Ridge Ln is a home with nearby schools including Mulberry Creek Elementary School, Creekside School, and Harris County Carver Middle School.
Ownership History
Date
Name
Owned For
Owner Type
Purchase Details
Closed on
Jul 8, 2024
Sold by
Blackmon Charles D
Bought by
Blackmon Charles D
Current Estimated Value
Purchase Details
Closed on
Dec 12, 2012
Sold by
R Jenkins Builder Inc
Bought by
Blackmon Charles D and Blackmon April
Home Financials for this Owner
Home Financials are based on the most recent Mortgage that was taken out on this home.
Original Mortgage
$214,412
Interest Rate
3.38%
Mortgage Type
VA
Purchase Details
Closed on
Nov 20, 2012
Sold by
Rollosson Kurtis A and Rollosson Erika H
Bought by
R Jenkins Builder Inc
Home Financials for this Owner
Home Financials are based on the most recent Mortgage that was taken out on this home.
Original Mortgage
$214,412
Interest Rate
3.38%
Mortgage Type
VA
Purchase Details
Closed on
Apr 19, 2011
Sold by
H & S Dev Inc
Bought by
R Jenkins Builder Inc
Create a Home Valuation Report for This Property
The Home Valuation Report is an in-depth analysis detailing your home's value as well as a comparison with similar homes in the area
Home Values in the Area
Average Home Value in this Area
Purchase History
| Date | Buyer | Sale Price | Title Company |
|---|---|---|---|
| Blackmon Charles D | -- | -- | |
| Blackmon Charles D | $209,900 | -- | |
| R Jenkins Builder Inc | -- | -- | |
| R Jenkins Builder Inc | $32,500 | -- |
Source: Public Records
Mortgage History
| Date | Status | Borrower | Loan Amount |
|---|---|---|---|
| Previous Owner | Blackmon Charles D | $214,412 | |
| Previous Owner | R Jenkins Builder Inc | $214,412 |
Source: Public Records
Tax History Compared to Growth
Tax History
| Year | Tax Paid | Tax Assessment Tax Assessment Total Assessment is a certain percentage of the fair market value that is determined by local assessors to be the total taxable value of land and additions on the property. | Land | Improvement |
|---|---|---|---|---|
| 2025 | $3,740 | $125,422 | $12,600 | $112,822 |
| 2024 | $3,404 | $122,225 | $12,600 | $109,625 |
| 2023 | $2,694 | $95,556 | $12,600 | $82,956 |
| 2022 | $2,694 | $95,556 | $12,600 | $82,956 |
| 2021 | $2,677 | $91,464 | $12,600 | $78,864 |
| 2020 | $2,677 | $91,464 | $12,600 | $78,864 |
| 2019 | $2,586 | $91,464 | $12,600 | $78,864 |
| 2018 | $2,636 | $91,464 | $12,600 | $78,864 |
| 2017 | $2,637 | $91,464 | $12,600 | $78,864 |
| 2016 | $2,237 | $84,540 | $12,600 | $71,940 |
| 2015 | $2,234 | $84,238 | $12,600 | $71,638 |
| 2014 | $2,238 | $84,238 | $12,600 | $71,638 |
| 2013 | -- | $84,237 | $12,600 | $71,637 |
Source: Public Records
Map
Nearby Homes
- 73 Cataula Dr
- 909 Red Fox Ct
- 11740 Ga Highway 315
- 299 Ridgeway Dr
- 13145 Ga Highway 315
- 492 Mulberry Crossing Dr
- 7131 US Highway 27
- 7777 Ga Highway 315
- 0 Walker Rd
- 921 Grey Smoke Trail
- 54 Waterford Dr
- 218 E East Bonacre Rd
- 235 Oak Grove Way
- 141 Voorhees Rd
- 1278 Jones Rd
- 509 Sweetwater Dr
- 511 Sweetwater Dr
- 385 Hudson Mill Cir
- 129 Hunter Rd
- 595 Hudson Mill Rd
- 199 Laurel Ridge Ln
- 253 Laurel Ridge Ln
- 79 Acorn Ct
- 45 Acorn Ct
- 151 Laurel Ridge Ln
- 35 Foliage Ct
- 248 Laurel Ridge Ln
- 23 Acorn Ct
- 276 Laurel Ridge Ln
- 147 Laurel Ridge Ln
- Lot 15 Acorn Ct
- 34 Foliage Ct
- 96 Acorn Ct
- 298 Laurel Ridge Ln
- 127 Laurel Ridge Ln
- 55 Foliage Ct
- 58 Acorn Ct
- 54 Foliage Ct
- 90 Acorn Ct
- 364 Laurel Ridge Ln