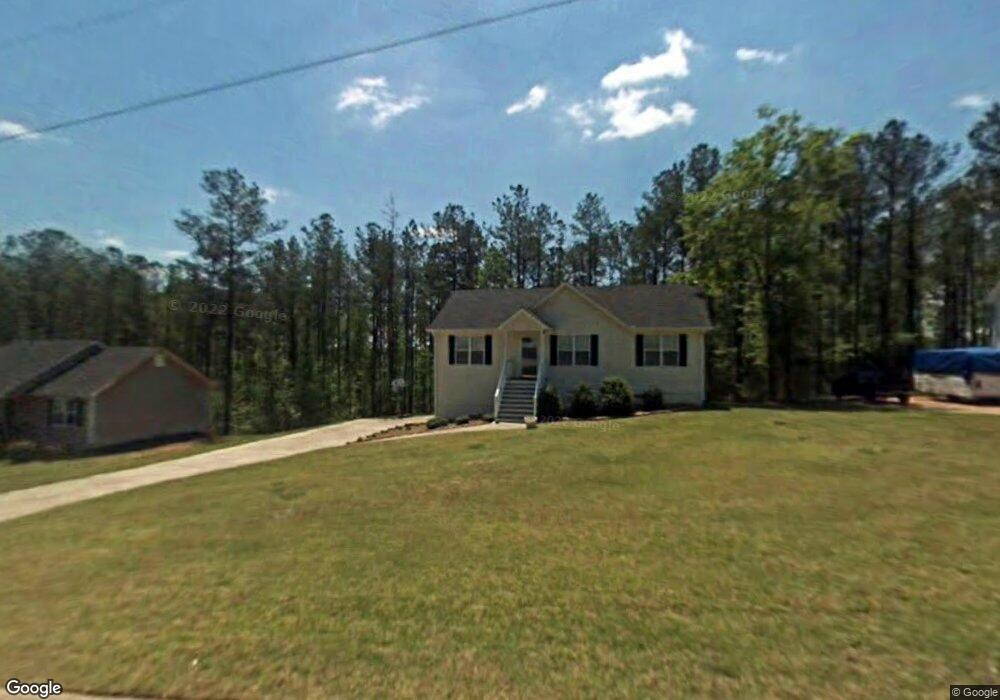
209 Martins Ct Unit 23 Villa Rica, GA 30180
Estimated Value: $262,000 - $271,435
3
Beds
2
Baths
1,118
Sq Ft
$238/Sq Ft
Est. Value
About This Home
This home is located at 209 Martins Ct Unit 23, Villa Rica, GA 30180 and is currently estimated at $266,109, approximately $238 per square foot. 209 Martins Ct Unit 23 is a home located in Carroll County with nearby schools including Glanton-Hindsman Elementary School, Villa Rica Middle School, and Villa Rica High School.
Ownership History
Date
Name
Owned For
Owner Type
Purchase Details
Closed on
Jul 9, 2018
Sold by
Harrison Joshua F
Bought by
Jackson Porsha
Current Estimated Value
Purchase Details
Closed on
Apr 30, 2015
Sold by
Springer Emily E
Bought by
Harrison Joshua F
Home Financials for this Owner
Home Financials are based on the most recent Mortgage that was taken out on this home.
Original Mortgage
$86,925
Interest Rate
3.8%
Mortgage Type
New Conventional
Purchase Details
Closed on
Jun 4, 2012
Sold by
Evans Emily R
Bought by
Springer Emily E
Purchase Details
Closed on
Nov 23, 2010
Sold by
Springer Carlos M
Bought by
Evans Emily R
Purchase Details
Closed on
Aug 16, 2001
Sold by
R & S Builders Llc
Bought by
Evans Emily R
Purchase Details
Closed on
Aug 4, 2000
Sold by
Hitchcock Hitchcock D and Hitchcock Jd M
Bought by
R & S Builders Llc
Purchase Details
Closed on
Apr 1, 2000
Bought by
Hitchcock Hitchcock D and Hitchcock Jd M
Create a Home Valuation Report for This Property
The Home Valuation Report is an in-depth analysis detailing your home's value as well as a comparison with similar homes in the area
Home Values in the Area
Average Home Value in this Area
Purchase History
| Date | Buyer | Sale Price | Title Company |
|---|---|---|---|
| Jackson Porsha | $135,000 | -- | |
| Harrison Joshua F | $91,500 | -- | |
| Springer Emily E | -- | -- | |
| Evans Emily R | -- | -- | |
| Evans Emily R | $93,600 | -- | |
| R & S Builders Llc | $95,000 | -- | |
| Hitchcock Hitchcock D | -- | -- |
Source: Public Records
Mortgage History
| Date | Status | Borrower | Loan Amount |
|---|---|---|---|
| Previous Owner | Harrison Joshua F | $86,925 |
Source: Public Records
Tax History Compared to Growth
Tax History
| Year | Tax Paid | Tax Assessment Tax Assessment Total Assessment is a certain percentage of the fair market value that is determined by local assessors to be the total taxable value of land and additions on the property. | Land | Improvement |
|---|---|---|---|---|
| 2024 | $1,861 | $100,684 | $8,000 | $92,684 |
| 2023 | $1,861 | $92,218 | $8,000 | $84,218 |
| 2022 | $1,598 | $75,666 | $8,000 | $67,666 |
| 2021 | $1,462 | $65,999 | $8,000 | $57,999 |
| 2020 | $1,223 | $52,632 | $8,000 | $44,632 |
| 2019 | $1,174 | $49,349 | $8,000 | $41,349 |
| 2018 | $1,099 | $41,863 | $8,000 | $33,863 |
| 2017 | $978 | $37,118 | $8,000 | $29,118 |
| 2016 | $964 | $37,118 | $8,000 | $29,118 |
| 2015 | $773 | $31,635 | $8,000 | $23,635 |
| 2014 | -- | $31,635 | $8,000 | $23,635 |
Source: Public Records
Map
Nearby Homes
- 104 Dalton Dr
- 100 Cedars Glen Cir
- 101 Cedars Glen Cir
- 178 Cedars Glen Cir
- 17 Cedars Glen Place
- 227 Cedars Glen Cir
- 213 Cornell Ct
- 504 Iris Way
- 436 Abbey Place
- 281 Cedars Glen Cir
- 275 Cedars Glen Cir
- 337 Cranmore Place
- 232 Harlan Heights Rd
- 84 Ledbetter Rd
- 1905 Rockmart Rd
- 1628 Rockmart Rd
- 114 Clay Ct
- 209 Martins Ct
- 58 Martins Ct
- 0 Martins Ct Unit 8724213
- 0 Martins Ct Unit 7289950
- 0 Martins Ct Unit 8270279
- 0 Martins Ct Unit 8768856
- 0 Martins Ct Unit 3212028
- 0 Martins Ct Unit 7029435
- 0 Martins Ct Unit 7150432
- 0 Martins Ct Unit 7233880
- 0 Martins Ct Unit 7494587
- 0 Martins Ct Unit 7508627
- 0 Martins Ct Unit 8680731
- 0 Martins Ct
- 205 Martins Ct
- 213 Martins Ct
- 204 Martins Ct
- 201 Martins Ct
- 201 Martins Ct
- 201 Martins Ct Unit /21