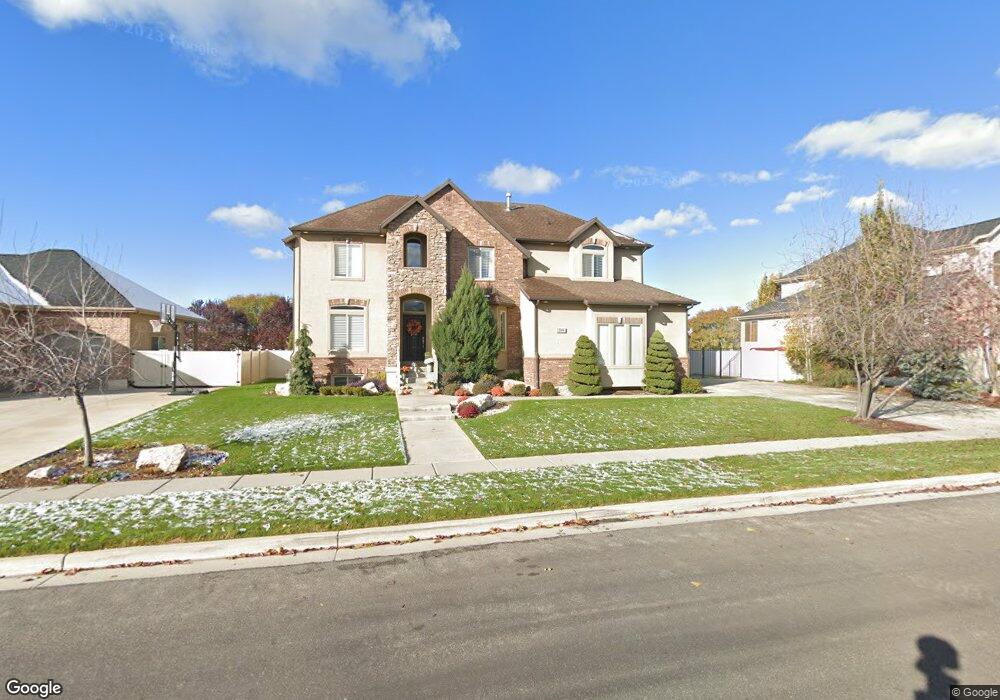
209 N 3050 W Layton, UT 84041
Estimated Value: $845,195 - $894,000
7
Beds
5
Baths
4,745
Sq Ft
$185/Sq Ft
Est. Value
About This Home
This home is located at 209 N 3050 W, Layton, UT 84041 and is currently estimated at $878,299, approximately $185 per square foot. 209 N 3050 W is a home located in Davis County with nearby schools including Sand Springs Elementary School, Legacy Junior High School, and Layton High School.
Ownership History
Date
Name
Owned For
Owner Type
Purchase Details
Closed on
Sep 30, 2019
Sold by
Young Carson
Bought by
Young Carson and Young Kristen
Current Estimated Value
Home Financials for this Owner
Home Financials are based on the most recent Mortgage that was taken out on this home.
Original Mortgage
$437,000
Outstanding Balance
$381,988
Interest Rate
3.5%
Mortgage Type
New Conventional
Estimated Equity
$496,311
Purchase Details
Closed on
Aug 3, 2017
Sold by
Andrews Melissa A and Andrews Thomas E
Bought by
Young Carson
Home Financials for this Owner
Home Financials are based on the most recent Mortgage that was taken out on this home.
Original Mortgage
$276,300
Interest Rate
3.9%
Mortgage Type
New Conventional
Purchase Details
Closed on
Aug 2, 2017
Sold by
Young Carson
Bought by
Young Carson and Young Kristen
Home Financials for this Owner
Home Financials are based on the most recent Mortgage that was taken out on this home.
Original Mortgage
$276,300
Interest Rate
3.9%
Mortgage Type
New Conventional
Purchase Details
Closed on
Jun 27, 2013
Sold by
Andrews Melissa A
Bought by
Andrews Thomas E
Purchase Details
Closed on
Apr 12, 2007
Sold by
Andrews Thomas E and Andrews Melissa A
Bought by
Andrews Thomas Edward and Andrews Melissa A
Home Financials for this Owner
Home Financials are based on the most recent Mortgage that was taken out on this home.
Original Mortgage
$384,000
Interest Rate
6.13%
Mortgage Type
New Conventional
Purchase Details
Closed on
May 9, 2006
Sold by
Andrews Melissa A
Bought by
Andrews Thomas E and Andrews Melissa A
Home Financials for this Owner
Home Financials are based on the most recent Mortgage that was taken out on this home.
Original Mortgage
$348,000
Interest Rate
6.3%
Mortgage Type
Fannie Mae Freddie Mac
Purchase Details
Closed on
May 8, 2006
Sold by
Landin Rene and Hernandez Casandra A
Bought by
Andrews Mellisa A
Home Financials for this Owner
Home Financials are based on the most recent Mortgage that was taken out on this home.
Original Mortgage
$348,000
Interest Rate
6.3%
Mortgage Type
Fannie Mae Freddie Mac
Purchase Details
Closed on
Jun 7, 2004
Sold by
Landin Rene and Hernandez Cassie
Bought by
Landin Rene and Hernandez Casandra A
Purchase Details
Closed on
Jan 16, 2004
Sold by
Cliff Bell Construction Inc
Bought by
Cliff Bell Construction Inc
Purchase Details
Closed on
Dec 22, 2003
Sold by
Mountain Green Development Llc
Bought by
Cliff Bell Construction Inc
Create a Home Valuation Report for This Property
The Home Valuation Report is an in-depth analysis detailing your home's value as well as a comparison with similar homes in the area
Home Values in the Area
Average Home Value in this Area
Purchase History
| Date | Buyer | Sale Price | Title Company |
|---|---|---|---|
| Young Carson | -- | Accommodation | |
| Young Carson | -- | Backman Title Services | |
| Young Carson | -- | -- | |
| Young Carson | -- | -- | |
| Young Carson | -- | Meridian Title | |
| Andrews Thomas E | -- | Juab Title & Abstract | |
| Andrews Thomas Edward | -- | Guardian Title Company | |
| Andrews Thomas E | -- | Accommodation | |
| Andrews Mellisa A | -- | Heritage West Title Ins Agen | |
| Landin Rene | -- | Heritage West Title Insuranc | |
| Landin Rene | -- | Heritage West Title Insuranc | |
| Cliff Bell Construction Inc | -- | Heritage West Title Ins | |
| Cliff Bell Construction Inc | -- | Bonneville Title Company Inc |
Source: Public Records
Mortgage History
| Date | Status | Borrower | Loan Amount |
|---|---|---|---|
| Open | Young Carson | $437,000 | |
| Closed | Young Carson | $276,300 | |
| Previous Owner | Andrews Thomas Edward | $384,000 | |
| Previous Owner | Andrews Mellisa A | $348,000 |
Source: Public Records
Tax History
| Year | Tax Paid | Tax Assessment Tax Assessment Total Assessment is a certain percentage of the fair market value that is determined by local assessors to be the total taxable value of land and additions on the property. | Land | Improvement |
|---|---|---|---|---|
| 2025 | $4,339 | $455,401 | $137,055 | $318,346 |
| 2024 | $4,203 | $444,400 | $145,704 | $298,696 |
| 2023 | $4,137 | $771,000 | $156,235 | $614,765 |
| 2022 | $4,385 | $443,850 | $89,596 | $354,254 |
| 2021 | $4,008 | $605,000 | $134,364 | $470,636 |
| 2020 | $3,404 | $493,000 | $115,175 | $377,825 |
| 2019 | $3,278 | $465,000 | $112,946 | $352,054 |
| 2018 | $2,999 | $427,000 | $99,632 | $327,368 |
| 2016 | $3,238 | $237,875 | $41,842 | $196,033 |
| 2015 | $3,182 | $221,870 | $41,842 | $180,028 |
| 2014 | $2,706 | $192,947 | $41,842 | $151,105 |
| 2013 | -- | $214,938 | $41,383 | $173,555 |
Source: Public Records
Map
Nearby Homes
- 273 N 2975 W
- 84 N 3225 W
- 2794 W Gentile St
- 245 S Summer Breeze Ln
- 34 S 3600 W
- 3535 W Overlook Dr
- 818 N 2625 W
- 263 S Sunburst Dr
- 306 S Sunburst Dr
- 2397 W Harmony Dr
- 2500 N North Fort Ln Unit 188
- 2350 N 720 W
- 2480 S Main St
- 1250 N 2925 W
- 841 N 2175 W
- 867 N 2125 W
- 195 E 2325 S
- 1141 N 2275 W
- 1974 W 775 N
- 3506 S Kite St
Your Personal Tour Guide
Ask me questions while you tour the home.