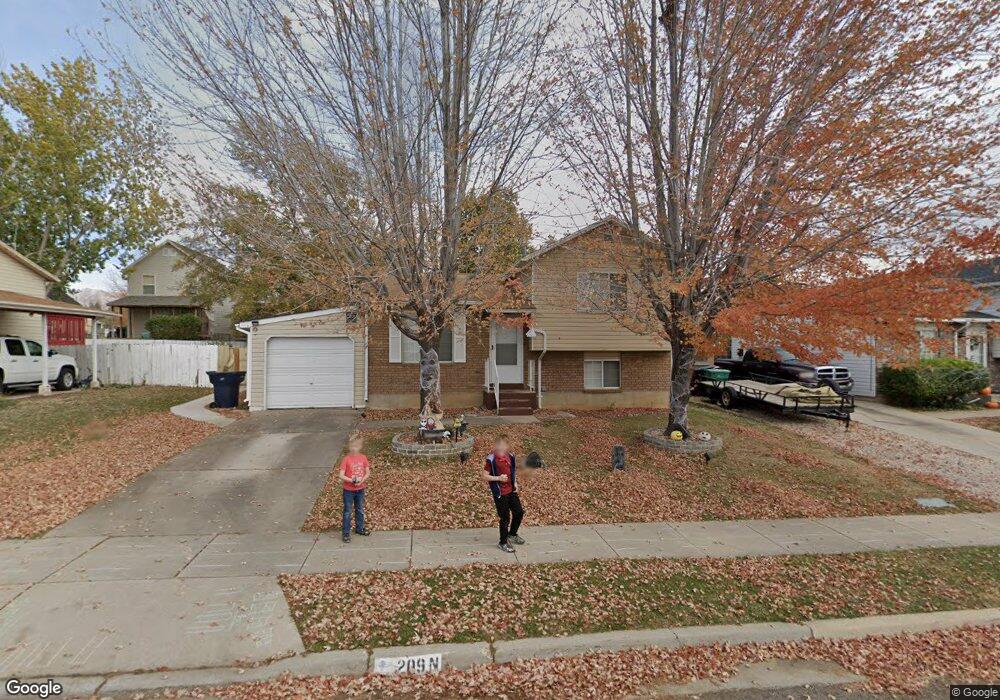
209 N 400 W Clearfield, UT 84015
Estimated Value: $385,000 - $441,000
3
Beds
2
Baths
1,341
Sq Ft
$299/Sq Ft
Est. Value
About This Home
This home is located at 209 N 400 W, Clearfield, UT 84015 and is currently estimated at $401,144, approximately $299 per square foot. 209 N 400 W is a home located in Davis County with nearby schools including Holt Elementary School, North Davis Junior High School, and Clearfield High School.
Ownership History
Date
Name
Owned For
Owner Type
Purchase Details
Closed on
Apr 26, 2018
Sold by
Anebil Real Estate Inv Inc
Bought by
Robles Salvador Aaron and Robles Arissa
Current Estimated Value
Home Financials for this Owner
Home Financials are based on the most recent Mortgage that was taken out on this home.
Original Mortgage
$10,185
Outstanding Balance
$8,740
Interest Rate
4.44%
Mortgage Type
New Conventional
Estimated Equity
$392,404
Purchase Details
Closed on
Nov 13, 2013
Sold by
Curtis William H
Bought by
Anebil Real Estate Investments Inc
Purchase Details
Closed on
Oct 3, 2007
Sold by
Robbins John C and Robbins Betty Jo
Bought by
Curtis William H
Home Financials for this Owner
Home Financials are based on the most recent Mortgage that was taken out on this home.
Original Mortgage
$140,850
Interest Rate
6.46%
Mortgage Type
Purchase Money Mortgage
Create a Home Valuation Report for This Property
The Home Valuation Report is an in-depth analysis detailing your home's value as well as a comparison with similar homes in the area
Home Values in the Area
Average Home Value in this Area
Purchase History
| Date | Buyer | Sale Price | Title Company |
|---|---|---|---|
| Robles Salvador Aaron | -- | Mountain America Title | |
| Anebil Real Estate Investments Inc | -- | Mountain America Title | |
| Curtis William H | -- | First American Title |
Source: Public Records
Mortgage History
| Date | Status | Borrower | Loan Amount |
|---|---|---|---|
| Open | Robles Salvador Aaron | $10,185 | |
| Open | Robles Salvador Aaron | $203,700 | |
| Previous Owner | Curtis William H | $140,850 |
Source: Public Records
Tax History Compared to Growth
Tax History
| Year | Tax Paid | Tax Assessment Tax Assessment Total Assessment is a certain percentage of the fair market value that is determined by local assessors to be the total taxable value of land and additions on the property. | Land | Improvement |
|---|---|---|---|---|
| 2025 | $2,154 | $193,050 | $61,324 | $131,726 |
| 2024 | $2,084 | $188,100 | $58,701 | $129,399 |
| 2023 | $1,931 | $320,000 | $94,954 | $225,046 |
| 2022 | $2,179 | $195,250 | $55,382 | $139,868 |
| 2021 | $2,016 | $273,000 | $53,783 | $219,217 |
| 2020 | $1,740 | $234,000 | $44,338 | $189,662 |
| 2019 | $1,673 | $222,000 | $49,846 | $172,154 |
| 2018 | $1,407 | $182,000 | $44,243 | $137,757 |
| 2016 | $1,243 | $84,040 | $17,337 | $66,703 |
| 2015 | $1,185 | $76,395 | $17,337 | $59,058 |
| 2014 | $1,125 | $73,465 | $17,337 | $56,128 |
| 2013 | -- | $60,929 | $29,650 | $31,279 |
Source: Public Records
Map
Nearby Homes