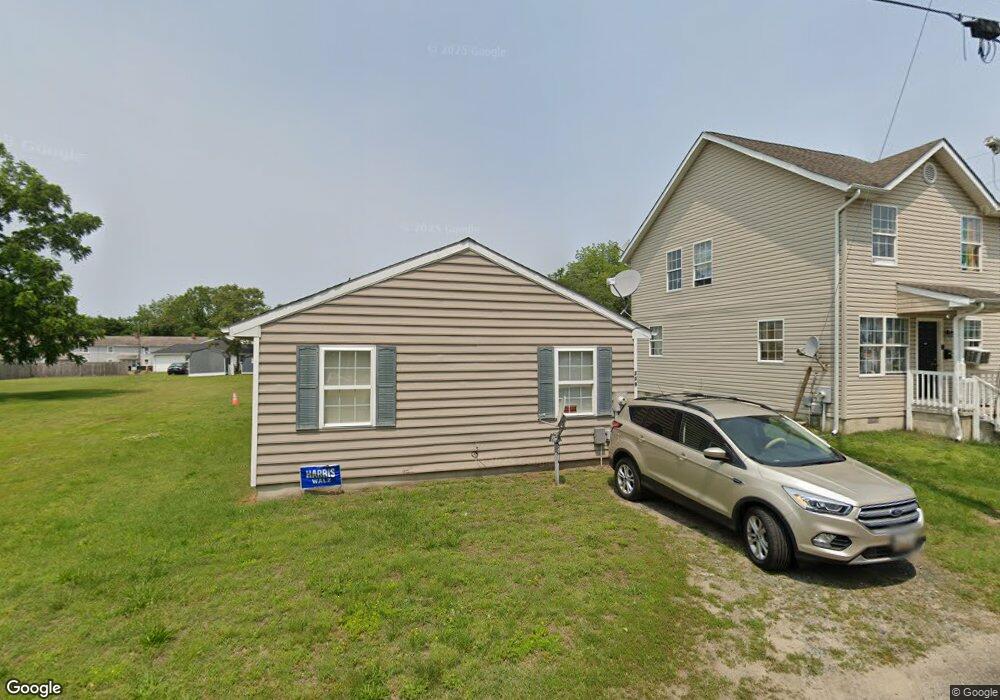
209 N 4th St Denton, MD 21629
Estimated Value: $174,464 - $221,000
--
Bed
1
Bath
720
Sq Ft
$275/Sq Ft
Est. Value
About This Home
This home is located at 209 N 4th St, Denton, MD 21629 and is currently estimated at $198,116, approximately $275 per square foot. 209 N 4th St is a home located in Caroline County with nearby schools including Denton Elementary School, Lockerman Middle School, and North Caroline High School.
Ownership History
Date
Name
Owned For
Owner Type
Purchase Details
Closed on
Jan 23, 1995
Sold by
Darling James C
Bought by
Thomas Pamela M
Current Estimated Value
Purchase Details
Closed on
Jun 29, 1994
Sold by
Barr Robert E
Bought by
Darling James C
Purchase Details
Closed on
Apr 24, 1990
Sold by
Canaan Land Inc.
Bought by
Barr Robert E
Home Financials for this Owner
Home Financials are based on the most recent Mortgage that was taken out on this home.
Original Mortgage
$29,750
Interest Rate
10.41%
Create a Home Valuation Report for This Property
The Home Valuation Report is an in-depth analysis detailing your home's value as well as a comparison with similar homes in the area
Home Values in the Area
Average Home Value in this Area
Purchase History
| Date | Buyer | Sale Price | Title Company |
|---|---|---|---|
| Thomas Pamela M | $45,000 | -- | |
| Darling James C | $5,000 | -- | |
| Barr Robert E | $24,500 | -- |
Source: Public Records
Mortgage History
| Date | Status | Borrower | Loan Amount |
|---|---|---|---|
| Previous Owner | Barr Robert E | $29,750 | |
| Closed | Thomas Pamela M | -- |
Source: Public Records
Tax History Compared to Growth
Tax History
| Year | Tax Paid | Tax Assessment Tax Assessment Total Assessment is a certain percentage of the fair market value that is determined by local assessors to be the total taxable value of land and additions on the property. | Land | Improvement |
|---|---|---|---|---|
| 2025 | $1,774 | $129,600 | $42,400 | $87,200 |
| 2024 | $1,728 | $122,600 | $0 | $0 |
| 2023 | $1,684 | $115,600 | $0 | $0 |
| 2022 | $1,630 | $108,600 | $42,400 | $66,200 |
| 2021 | $1,517 | $99,267 | $0 | $0 |
| 2020 | $1,517 | $89,933 | $0 | $0 |
| 2019 | $1,452 | $80,600 | $23,600 | $57,000 |
| 2018 | $1,429 | $79,733 | $0 | $0 |
| 2017 | $1,398 | $78,867 | $0 | $0 |
| 2016 | -- | $78,000 | $0 | $0 |
| 2015 | $1,331 | $78,000 | $0 | $0 |
| 2014 | $1,331 | $78,000 | $0 | $0 |
Source: Public Records
Map
Nearby Homes
- 501 Lincoln St
- 536 Gay St
- 4 S 1st St
- 106 S 6th St
- 208 S 3rd St
- 800 Gay St
- 804 Gay St
- 307 Academy Ave
- 300 S 1st St
- 1005 Market St
- 106 Briarwood Cir
- 318 Carter Ave
- 24872 Meeting House Rd
- 121 Edenton Ln
- 311 Kerr Ave
- 1105 Market St
- 1403 Blue Heron Dr
- 1202 Blue Heron Dr
- 1111 Ruddy Duck Ct
- 1302 Trice Meadows Cir