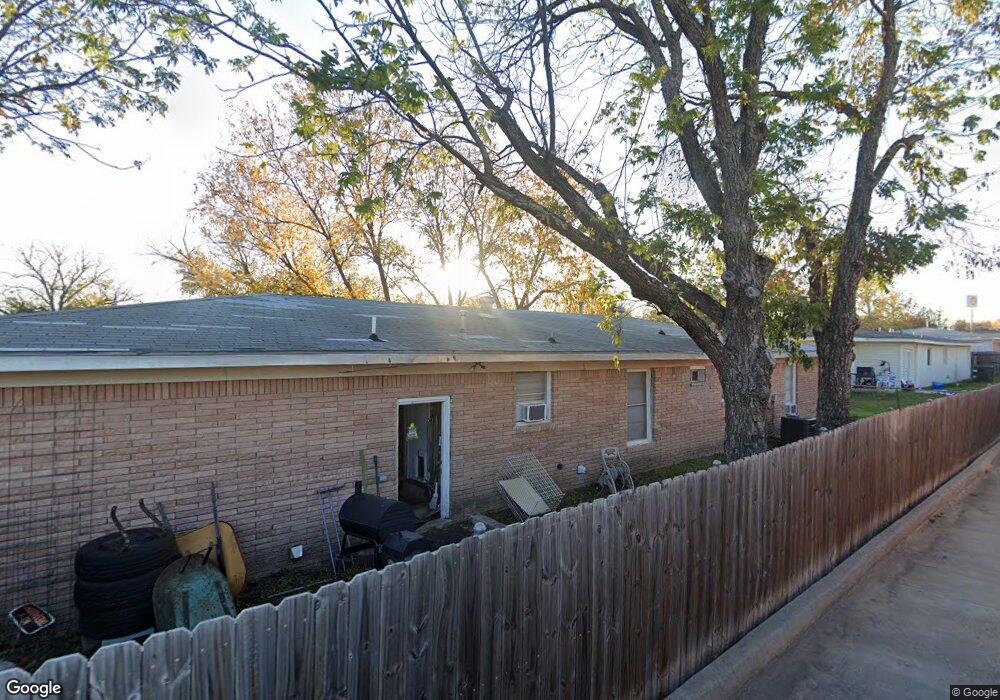
209 N Mcentire Ct Fort Worth, TX 76108
Estimated Value: $216,769 - $241,000
3
Beds
2
Baths
1,428
Sq Ft
$160/Sq Ft
Est. Value
About This Home
This home is located at 209 N Mcentire Ct, Fort Worth, TX 76108 and is currently estimated at $228,885, approximately $160 per square foot. 209 N Mcentire Ct is a home located in Tarrant County with nearby schools including West Elementary School, Brewer Middle School, and Tannahill Intermediate School.
Ownership History
Date
Name
Owned For
Owner Type
Purchase Details
Closed on
Oct 30, 2025
Sold by
Gene & Donna Thompson Irrevocable Trust and Byrne Dana
Bought by
Gene Thompson Investments Llc
Current Estimated Value
Purchase Details
Closed on
Oct 24, 2013
Sold by
Gullinese Mardenna O Neice
Bought by
Thompson Gene A
Create a Home Valuation Report for This Property
The Home Valuation Report is an in-depth analysis detailing your home's value as well as a comparison with similar homes in the area
Home Values in the Area
Average Home Value in this Area
Purchase History
| Date | Buyer | Sale Price | Title Company |
|---|---|---|---|
| Gene Thompson Investments Llc | -- | None Listed On Document | |
| Thompson Gene A | -- | Rtc |
Source: Public Records
Tax History Compared to Growth
Tax History
| Year | Tax Paid | Tax Assessment Tax Assessment Total Assessment is a certain percentage of the fair market value that is determined by local assessors to be the total taxable value of land and additions on the property. | Land | Improvement |
|---|---|---|---|---|
| 2025 | $4,369 | $161,577 | $31,580 | $129,997 |
| 2024 | $4,369 | $184,429 | $31,580 | $152,849 |
| 2023 | $3,923 | $165,000 | $31,580 | $133,420 |
| 2022 | $4,402 | $162,540 | $31,250 | $131,290 |
| 2021 | $3,915 | $142,327 | $31,250 | $111,077 |
| 2020 | $2,727 | $98,422 | $31,250 | $67,172 |
| 2019 | $2,831 | $98,422 | $31,250 | $67,172 |
| 2018 | $2,647 | $92,000 | $15,000 | $77,000 |
| 2017 | $2,689 | $92,000 | $15,000 | $77,000 |
| 2016 | $2,576 | $88,151 | $15,000 | $73,151 |
| 2015 | $1,821 | $63,400 | $15,500 | $47,900 |
| 2014 | $1,821 | $63,400 | $15,500 | $47,900 |
Source: Public Records
Map
Nearby Homes
- 204 Lanham Ct
- 9221 White Settlement Rd
- 9104 White Settlement Rd
- 9200 Farmers Rd
- 9201 Clifford St
- 2860 Fox Trail Ln
- 10937 Elata Dr
- 201 N Normandale St
- 9100 Rowland Dr
- 8814 Clifford St
- 9005 Glenn Dr
- 308 Hallvale Dr
- 2640 Wispy Creek Dr
- 2629 Clear Root Cir
- 2625 Clear Root Cir
- 10044 Crystal Bend Dr
- 2624 Clear Root Cir
- 2621 Clear Root Cir
- 2637 Clear Root Cir
- 2700 Wispy Creek Dr
- 205 N Mcentire Ct
- 108 Jim Wright Fwy
- 108 Jim Wright Fwy Unit 102
- 208 N Mcentire Ct
- 9224 Raymond Ave
- 201 N Mcentire Ct
- 9228 Raymond Ave
- 9213 Raymond Ave
- 200 N Jim Wright Fwy
- 9216 Lanham St
- 9216 Raymond Ave
- 133 N Mcentire Ct
- 9212 Lanham St
- 9209 Raymond Ave
- 129 N Mcentire Ct
- 9208 Raymond Ave
- 9208 Lanham St
- 9205 Raymond Ave
- 128 N Mcentire Ct
- 125 N Mcentire Ct