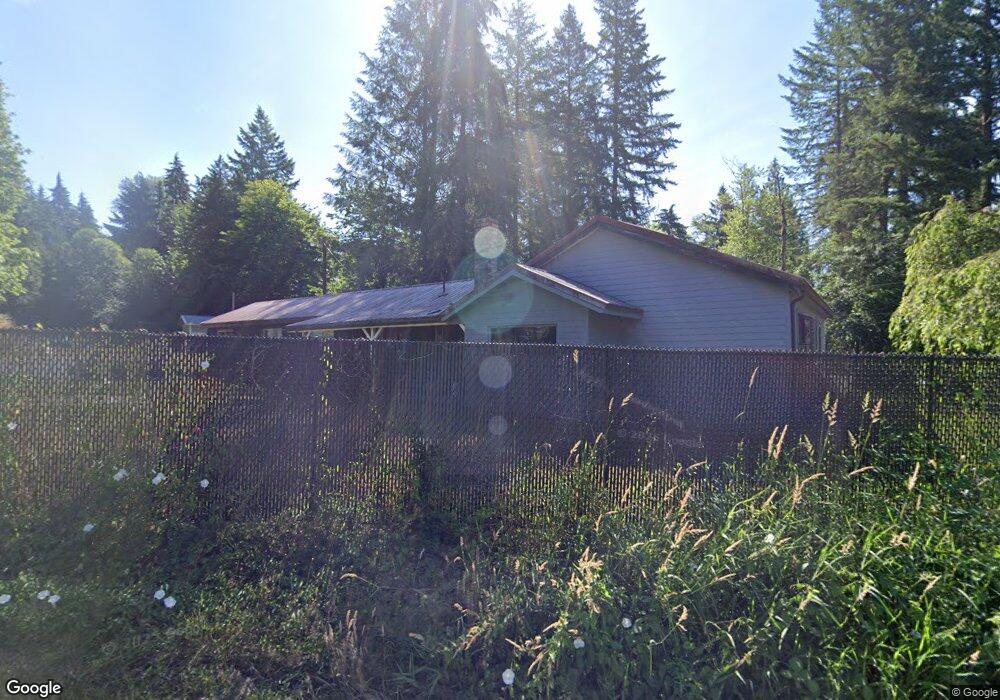
209 Newberg Rd Snohomish, WA 98290
Estimated Value: $590,000 - $804,000
3
Beds
1
Bath
1,728
Sq Ft
$392/Sq Ft
Est. Value
About This Home
This home is located at 209 Newberg Rd, Snohomish, WA 98290 and is currently estimated at $677,234, approximately $391 per square foot. 209 Newberg Rd is a home located in Snohomish County with nearby schools including Machias Elementary School, Centennial Middle School, and Snohomish High School.
Ownership History
Date
Name
Owned For
Owner Type
Purchase Details
Closed on
Aug 10, 2022
Sold by
Travis Darby
Bought by
Darby Melissa Sue
Current Estimated Value
Purchase Details
Closed on
Sep 28, 2011
Sold by
Hsbc Bank Usa National Association
Bought by
Darby Travis
Home Financials for this Owner
Home Financials are based on the most recent Mortgage that was taken out on this home.
Original Mortgage
$131,122
Interest Rate
3.95%
Mortgage Type
New Conventional
Purchase Details
Closed on
Nov 17, 2010
Sold by
Harrington Andrew and Harrington Bethany
Bought by
Hsbc Bank Usa National Association
Purchase Details
Closed on
May 4, 2006
Sold by
Stadin John E and Stadin Mia T
Bought by
Harrington Andrew and Harrington Bethany
Home Financials for this Owner
Home Financials are based on the most recent Mortgage that was taken out on this home.
Original Mortgage
$280,202
Interest Rate
8.25%
Mortgage Type
Balloon
Create a Home Valuation Report for This Property
The Home Valuation Report is an in-depth analysis detailing your home's value as well as a comparison with similar homes in the area
Home Values in the Area
Average Home Value in this Area
Purchase History
| Date | Buyer | Sale Price | Title Company |
|---|---|---|---|
| Darby Melissa Sue | -- | None Listed On Document | |
| Darby Travis | $128,780 | Servicelink | |
| Hsbc Bank Usa National Association | $200,000 | None Available | |
| Harrington Andrew | $294,950 | Chicago Title |
Source: Public Records
Mortgage History
| Date | Status | Borrower | Loan Amount |
|---|---|---|---|
| Previous Owner | Darby Travis | $131,122 | |
| Previous Owner | Harrington Andrew | $280,202 |
Source: Public Records
Tax History Compared to Growth
Tax History
| Year | Tax Paid | Tax Assessment Tax Assessment Total Assessment is a certain percentage of the fair market value that is determined by local assessors to be the total taxable value of land and additions on the property. | Land | Improvement |
|---|---|---|---|---|
| 2025 | $3,967 | $435,900 | $345,400 | $90,500 |
| 2024 | $3,967 | $383,600 | $303,200 | $80,400 |
| 2023 | $4,431 | $479,900 | $343,400 | $136,500 |
| 2022 | $4,037 | $350,100 | $239,700 | $110,400 |
| 2020 | $3,204 | $257,400 | $184,500 | $72,900 |
| 2019 | $3,157 | $251,900 | $182,800 | $69,100 |
| 2018 | $3,354 | $229,900 | $143,500 | $86,400 |
| 2017 | $2,936 | $206,000 | $123,600 | $82,400 |
| 2016 | $2,607 | $174,600 | $93,100 | $81,500 |
| 2015 | $2,435 | $155,500 | $74,900 | $80,600 |
| 2013 | $2,369 | $145,200 | $71,300 | $73,900 |
Source: Public Records
Map
Nearby Homes
- 413 Newberg Rd
- 321 Price Rd
- 0 Ok Mill Rd
- 530 175th Ave NE
- 601 Beach Dr
- 921 Russell Rd
- 0 161st St Unit NWM2403733
- 2805 Newberg Rd
- 2424 159th Place NE
- 3114 159th Ave NE
- 2620 157th Ave SE
- 1607 Austin Ave
- 2117 140th Ave SE
- 17629 Newberg Rd
- 1516 131st Ave NE
- 1806 131st Dr NE
- 13123 21st Ct NE
- 13121 21st Ct NE
- 3412 147th Ave NE
- 13322 S Machias Rd
- 47 Newberg Rd
- 16226 Ok Mill Rd
- 208 Newberg Rd
- 208 Newberg Rd
- 226 Newberg Rd
- 315 Newberg Rd
- 320 Newberg Rd
- 16213 Ok Mill Rd
- 16212 Ok Mill Rd
- 412 Newberg Rd
- 16114 Ok Mill Rd
- 401 Newberg Rd
- 400 Newberg Rd
- 16330 Ok Mill Rd
- 414 Newberg Rd
- 416 Newberg Rd
- 16105 Ok Mill Rd
- 16227 Ok Mill Rd
- 16102 Ok Mill Rd
- 423 Newberg Rd