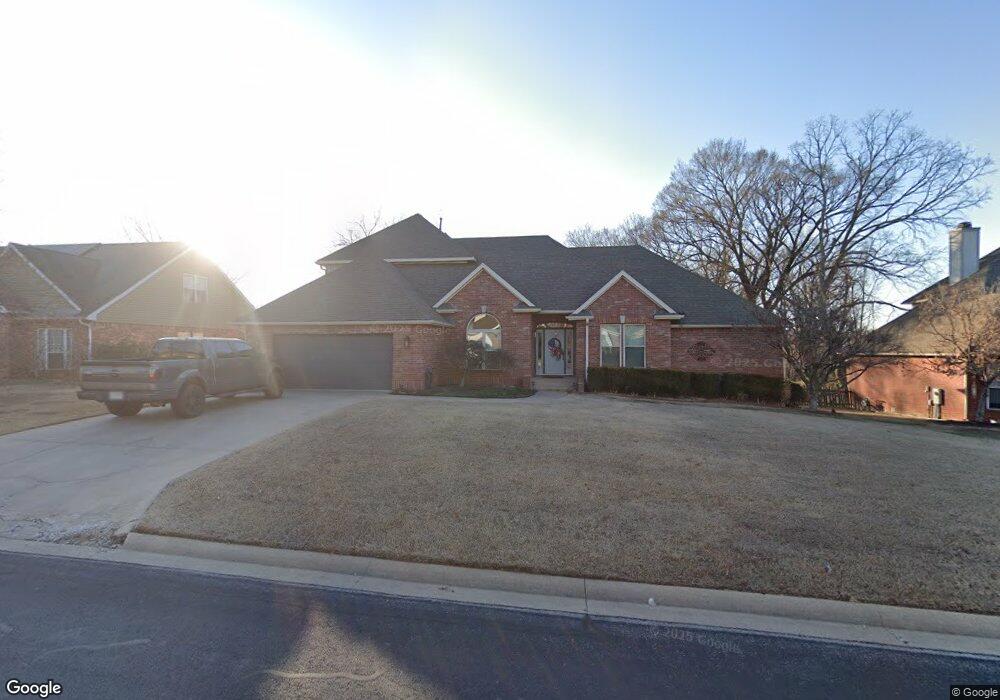
209 NW O St Bentonville, AR 72712
Estimated Value: $845,052 - $948,000
4
Beds
4
Baths
3,941
Sq Ft
$227/Sq Ft
Est. Value
About This Home
This home is located at 209 NW O St, Bentonville, AR 72712 and is currently estimated at $894,263, approximately $226 per square foot. 209 NW O St is a home located in Benton County with nearby schools including Thomas Jefferson Elementary School, Ardis Ann Middle School, and Lincoln Junior High School.
Ownership History
Date
Name
Owned For
Owner Type
Purchase Details
Closed on
Nov 9, 2023
Sold by
Fletcher Alfred J
Bought by
Fletcher Alfred and Fletcher Alfred Jesse
Current Estimated Value
Purchase Details
Closed on
Jun 30, 2011
Sold by
Vanbrederode John
Bought by
Fletcher Alfred J
Home Financials for this Owner
Home Financials are based on the most recent Mortgage that was taken out on this home.
Original Mortgage
$285,000
Interest Rate
4.55%
Purchase Details
Closed on
Dec 15, 2009
Sold by
Montgomery Kenneth Scott and Montgomery Ann Michelle
Bought by
Vanbrederode John
Home Financials for this Owner
Home Financials are based on the most recent Mortgage that was taken out on this home.
Original Mortgage
$270,000
Interest Rate
4.82%
Mortgage Type
New Conventional
Purchase Details
Closed on
Oct 8, 2003
Bought by
Montgomery 2P
Purchase Details
Closed on
Jan 5, 1994
Bought by
Simpson
Purchase Details
Closed on
Jun 24, 1993
Bought by
Austin
Create a Home Valuation Report for This Property
The Home Valuation Report is an in-depth analysis detailing your home's value as well as a comparison with similar homes in the area
Home Values in the Area
Average Home Value in this Area
Purchase History
| Date | Buyer | Sale Price | Title Company |
|---|---|---|---|
| Fletcher Alfred | -- | None Listed On Document | |
| Fletcher Alfred J | $300,000 | First National Title Company | |
| Vanbrederode John | $338,000 | None Available | |
| Montgomery 2P | $180,000 | -- | |
| Simpson | $148,000 | -- | |
| Austin | $23,000 | -- |
Source: Public Records
Mortgage History
| Date | Status | Borrower | Loan Amount |
|---|---|---|---|
| Previous Owner | Fletcher Alfred J | $285,000 | |
| Previous Owner | Vanbrederode John | $270,000 |
Source: Public Records
Tax History Compared to Growth
Tax History
| Year | Tax Paid | Tax Assessment Tax Assessment Total Assessment is a certain percentage of the fair market value that is determined by local assessors to be the total taxable value of land and additions on the property. | Land | Improvement |
|---|---|---|---|---|
| 2025 | $4,900 | $116,403 | $24,000 | $92,403 |
| 2024 | $4,699 | $116,403 | $24,000 | $92,403 |
| 2023 | $4,475 | $74,540 | $11,400 | $63,140 |
| 2022 | $4,009 | $74,540 | $11,400 | $63,140 |
| 2021 | $3,796 | $74,540 | $11,400 | $63,140 |
| 2020 | $3,636 | $62,960 | $10,000 | $52,960 |
| 2019 | $3,515 | $62,960 | $10,000 | $52,960 |
| 2018 | $3,378 | $62,960 | $10,000 | $52,960 |
| 2017 | $2,947 | $62,960 | $10,000 | $52,960 |
| 2016 | $2,947 | $62,960 | $10,000 | $52,960 |
| 2015 | $3,146 | $50,900 | $10,000 | $40,900 |
| 2014 | $2,796 | $50,900 | $10,000 | $40,900 |
Source: Public Records
Map
Nearby Homes
- 315 NW O St
- 0 NW Olinka Pass St
- 214 El Contento Dr
- 3631 Bitterroot Cove
- 0 SW 2nd St
- 411 NW Saddlebrook Dr
- 103 NW J St
- 312 NW J St
- 1110 NW 7th St
- 2605 NW 6th St
- 703 NW J St
- 701 NW Ford Ln
- 101 Oakhurst St
- 206 SW Tunbridge Dr
- 1002 NW 9th St
- 1201 NW 10th St
- 808 W Central Ave
- 912 NW 9th St
- 1004 Robin Haven Dr
- Lot 2 NW G St