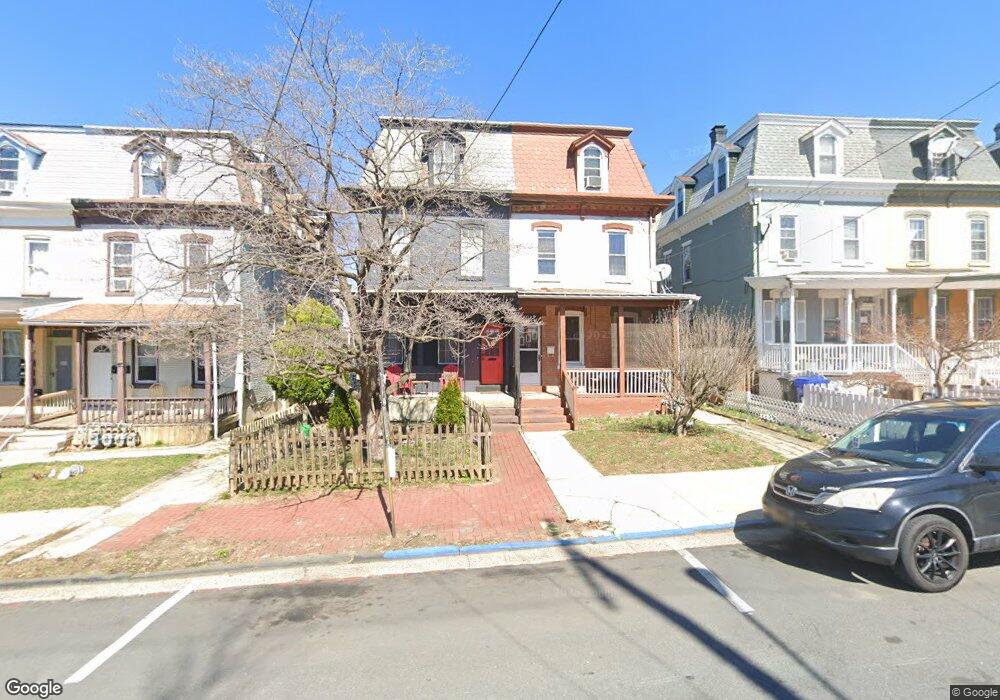
209 Oley St Reading, PA 19601
Northwest Reading NeighborhoodEstimated Value: $112,000 - $245,000
5
Beds
1
Bath
2,024
Sq Ft
$92/Sq Ft
Est. Value
About This Home
This home is located at 209 Oley St, Reading, PA 19601 and is currently estimated at $185,658, approximately $91 per square foot. 209 Oley St is a home located in Berks County with nearby schools including Riverside Elementary School, Northwest Middle School, and Reading Senior High School.
Ownership History
Date
Name
Owned For
Owner Type
Purchase Details
Closed on
Jul 19, 2024
Sold by
Khan Robert
Bought by
Khan Jadah Betty
Current Estimated Value
Home Financials for this Owner
Home Financials are based on the most recent Mortgage that was taken out on this home.
Original Mortgage
$186,558
Outstanding Balance
$184,330
Interest Rate
6.99%
Mortgage Type
FHA
Estimated Equity
$1,328
Purchase Details
Closed on
Nov 8, 2006
Sold by
Morales Jerry and Morales Maria
Bought by
Khan Robert
Home Financials for this Owner
Home Financials are based on the most recent Mortgage that was taken out on this home.
Original Mortgage
$76,000
Interest Rate
6.4%
Mortgage Type
New Conventional
Purchase Details
Closed on
Dec 3, 2004
Sold by
Rehr William H and Rehr Patricia J
Bought by
Morales Jerry and Morales Maria
Home Financials for this Owner
Home Financials are based on the most recent Mortgage that was taken out on this home.
Original Mortgage
$39,150
Interest Rate
5.81%
Mortgage Type
Fannie Mae Freddie Mac
Create a Home Valuation Report for This Property
The Home Valuation Report is an in-depth analysis detailing your home's value as well as a comparison with similar homes in the area
Home Values in the Area
Average Home Value in this Area
Purchase History
| Date | Buyer | Sale Price | Title Company |
|---|---|---|---|
| Khan Jadah Betty | $190,000 | Conestoga Title | |
| Khan Robert | -- | Richmond Title Services Lp | |
| Morales Jerry | $43,500 | First American Title Ins Co |
Source: Public Records
Mortgage History
| Date | Status | Borrower | Loan Amount |
|---|---|---|---|
| Open | Khan Jadah Betty | $186,558 | |
| Previous Owner | Khan Robert | $76,000 | |
| Previous Owner | Morales Jerry | $39,150 |
Source: Public Records
Tax History
| Year | Tax Paid | Tax Assessment Tax Assessment Total Assessment is a certain percentage of the fair market value that is determined by local assessors to be the total taxable value of land and additions on the property. | Land | Improvement |
|---|---|---|---|---|
| 2025 | $1,322 | $48,700 | $10,800 | $37,900 |
| 2024 | $2,162 | $48,700 | $10,800 | $37,900 |
| 2023 | $2,129 | $48,700 | $10,800 | $37,900 |
| 2022 | $2,129 | $48,700 | $10,800 | $37,900 |
| 2021 | $2,129 | $48,700 | $10,800 | $37,900 |
| 2020 | $2,108 | $48,700 | $10,800 | $37,900 |
| 2019 | $2,108 | $48,700 | $10,800 | $37,900 |
| 2018 | $2,108 | $48,700 | $10,800 | $37,900 |
| 2017 | $2,094 | $48,700 | $10,800 | $37,900 |
| 2016 | $1,196 | $48,700 | $10,800 | $37,900 |
| 2015 | $1,196 | $48,700 | $10,800 | $37,900 |
| 2014 | $1,101 | $48,700 | $10,800 | $37,900 |
Source: Public Records
Map
Nearby Homes
- 723 Thorn St
- 725 Pear St
- 852 Thorn St
- 531 N Front St
- 131 W Greenwich St
- 725 Madison Ave
- 825 N 4th St
- 425 N 2nd St
- 824 Madison Ave
- 119 Windsor St
- 163 W Greenwich St
- 815 Weiser St
- 138 W Windsor St
- 433 Windsor St
- 439 Buttonwood St
- 413 Rosenthal St
- 120 W Buttonwood St
- 762 N 6th St
- 521 Windsor St
- 137 Elm St
Your Personal Tour Guide
Ask me questions while you tour the home.