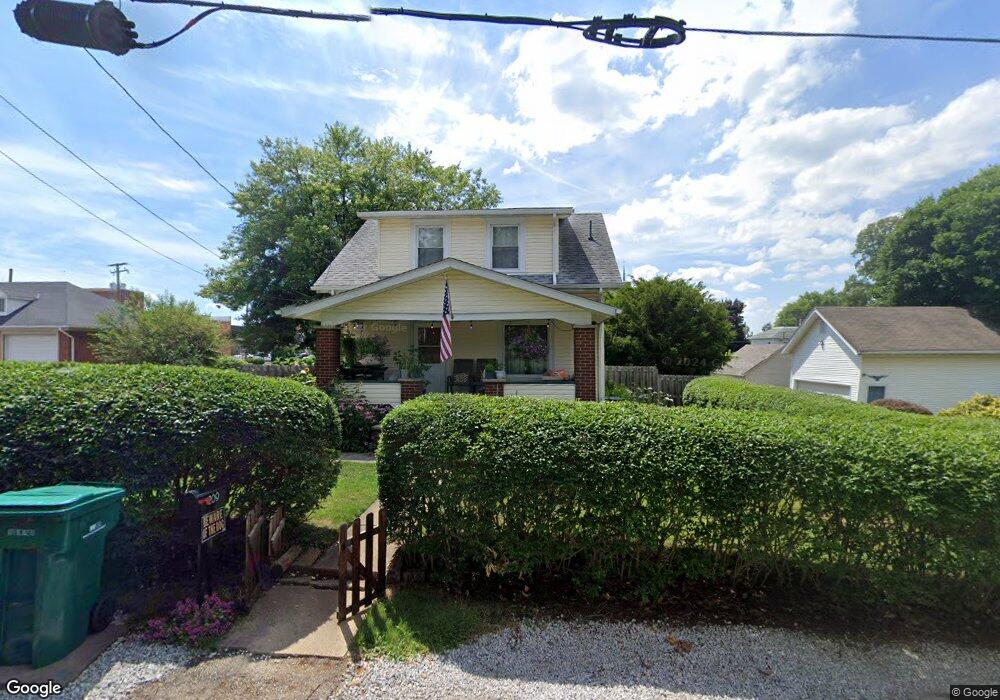
209 Orchard Ave Louisville, OH 44641
Estimated Value: $164,408 - $173,000
2
Beds
2
Baths
1,248
Sq Ft
$135/Sq Ft
Est. Value
About This Home
This home is located at 209 Orchard Ave, Louisville, OH 44641 and is currently estimated at $168,852, approximately $135 per square foot. 209 Orchard Ave is a home located in Stark County with nearby schools including Louisville High School and St. Thomas Aquinas High School & Middle School.
Ownership History
Date
Name
Owned For
Owner Type
Purchase Details
Closed on
Feb 23, 2007
Sold by
Begue Gary J and Begue Cynthia L
Bought by
Hoopes Elizabeth A
Current Estimated Value
Home Financials for this Owner
Home Financials are based on the most recent Mortgage that was taken out on this home.
Original Mortgage
$90,000
Outstanding Balance
$54,116
Interest Rate
6.23%
Mortgage Type
Purchase Money Mortgage
Estimated Equity
$114,736
Purchase Details
Closed on
Mar 31, 1994
Create a Home Valuation Report for This Property
The Home Valuation Report is an in-depth analysis detailing your home's value as well as a comparison with similar homes in the area
Home Values in the Area
Average Home Value in this Area
Purchase History
| Date | Buyer | Sale Price | Title Company |
|---|---|---|---|
| Hoopes Elizabeth A | $90,000 | None Available | |
| -- | $55,000 | -- |
Source: Public Records
Mortgage History
| Date | Status | Borrower | Loan Amount |
|---|---|---|---|
| Open | Hoopes Elizabeth A | $90,000 |
Source: Public Records
Tax History Compared to Growth
Tax History
| Year | Tax Paid | Tax Assessment Tax Assessment Total Assessment is a certain percentage of the fair market value that is determined by local assessors to be the total taxable value of land and additions on the property. | Land | Improvement |
|---|---|---|---|---|
| 2025 | -- | $43,580 | $11,340 | $32,240 |
| 2024 | -- | $43,580 | $11,340 | $32,240 |
| 2023 | $1,440 | $33,500 | $8,580 | $24,920 |
| 2022 | $1,446 | $33,500 | $8,580 | $24,920 |
| 2021 | $1,450 | $33,500 | $8,580 | $24,920 |
| 2020 | $1,155 | $28,980 | $7,700 | $21,280 |
| 2019 | $1,160 | $28,990 | $7,700 | $21,290 |
| 2018 | $1,156 | $28,990 | $7,700 | $21,290 |
| 2017 | $1,006 | $24,330 | $6,160 | $18,170 |
| 2016 | $1,027 | $24,330 | $6,160 | $18,170 |
| 2015 | $1,030 | $24,330 | $6,160 | $18,170 |
| 2014 | $1,032 | $22,680 | $5,740 | $16,940 |
| 2013 | $520 | $22,680 | $5,740 | $16,940 |
Source: Public Records
Map
Nearby Homes
- 325 Lincoln Ave
- 107 E Broad St
- 204 E Broad St
- 728 E Broad St
- 308 Superior St
- 520 S Silver St
- 641 S Nickelplate St
- 0 Michigan Blvd
- 300 Kennedy St
- 1170 Winding Ridge Ave
- 428 Honeycrisp Dr NE
- 3047 Mcintosh Dr NE
- 432 Honeycrisp Dr NE
- 2962 Mcintosh Dr NE
- 2963 Mcintosh Dr NE
- 430 Honeycrisp Dr NE
- 2957 Mcintosh Dr NE
- 910 Crosswyck Cir
- 316 E Reno Dr
- 1715 High St
- 112 Orchard Ave
- 502 Washington Ave
- 404 Washington Ave
- 400 Washington Ave
- 506 Washington Ave
- 510 Washington Ave
- 300 N Mill St
- 518 Washington Ave
- 304 N Mill St
- 407 E Main St
- 507 E Main St
- 411 Washington Ave
- 407 Washington Ave
- 401 Washington Ave
- 309 Washington Ave
- 203 N Walnut St
- 215 N Walnut St
- 517 E Main St
- 505 Washington Ave
- 310 N Mill St