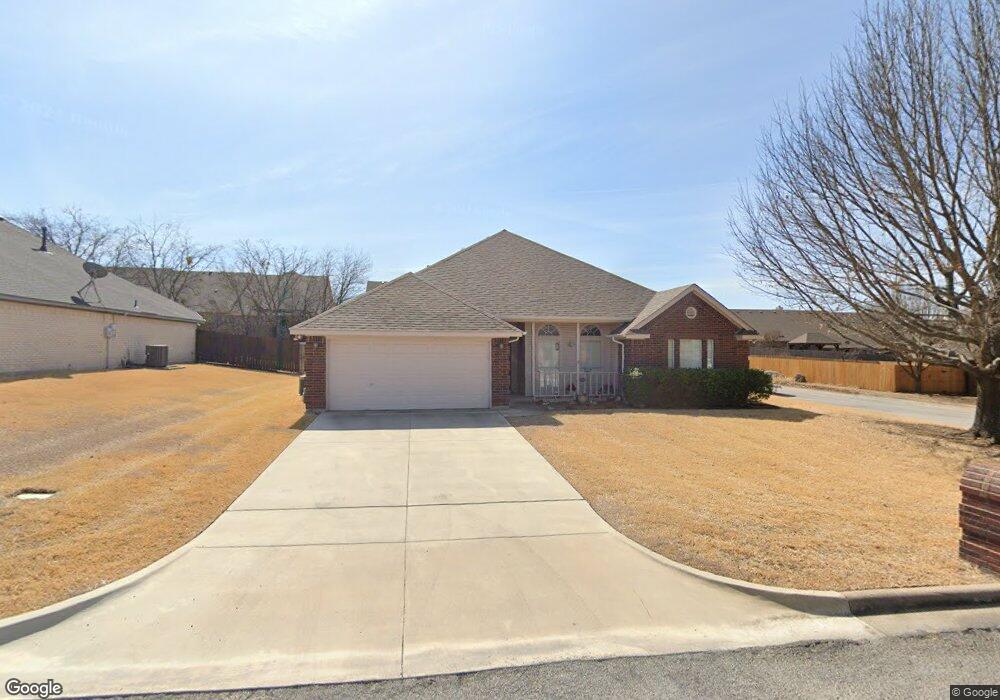
209 Ridge View Ct Decatur, TX 76234
Estimated Value: $312,926 - $365,000
4
Beds
2
Baths
1,858
Sq Ft
$182/Sq Ft
Est. Value
About This Home
This home is located at 209 Ridge View Ct, Decatur, TX 76234 and is currently estimated at $337,982, approximately $181 per square foot. 209 Ridge View Ct is a home located in Wise County with nearby schools including Decatur High School and Victory Christian Academy.
Ownership History
Date
Name
Owned For
Owner Type
Purchase Details
Closed on
Nov 19, 2024
Sold by
Pugsley Kay
Bought by
Powers Zachary and Powers Bethany
Current Estimated Value
Home Financials for this Owner
Home Financials are based on the most recent Mortgage that was taken out on this home.
Original Mortgage
$299,570
Outstanding Balance
$295,973
Interest Rate
6.12%
Mortgage Type
VA
Estimated Equity
$42,009
Purchase Details
Closed on
Sep 29, 2016
Sold by
Qualls Janice L
Bought by
Pugsley Kay
Purchase Details
Closed on
Sep 4, 2001
Sold by
Aaron Baltazar Ltd
Bought by
Pugsley Kay L
Purchase Details
Closed on
Nov 14, 2000
Sold by
Qualls Ted S and Qualls Janice
Bought by
Pugsley Kay L
Purchase Details
Closed on
Jan 4, 2000
Sold by
Fenoglio Tommy L and Horton Elli
Bought by
Pugsley Kay L
Purchase Details
Closed on
Aug 6, 1999
Sold by
Fenoglio Tommy L and May Charles
Bought by
Pugsley Kay L
Create a Home Valuation Report for This Property
The Home Valuation Report is an in-depth analysis detailing your home's value as well as a comparison with similar homes in the area
Home Values in the Area
Average Home Value in this Area
Purchase History
| Date | Buyer | Sale Price | Title Company |
|---|---|---|---|
| Powers Zachary | -- | None Listed On Document | |
| Pugsley Kay | -- | Wise County Title Company | |
| Pugsley Kay L | -- | -- | |
| Pugsley Kay L | -- | -- | |
| Pugsley Kay L | -- | -- | |
| Pugsley Kay L | -- | -- |
Source: Public Records
Mortgage History
| Date | Status | Borrower | Loan Amount |
|---|---|---|---|
| Open | Powers Zachary | $299,570 |
Source: Public Records
Tax History Compared to Growth
Tax History
| Year | Tax Paid | Tax Assessment Tax Assessment Total Assessment is a certain percentage of the fair market value that is determined by local assessors to be the total taxable value of land and additions on the property. | Land | Improvement |
|---|---|---|---|---|
| 2025 | $1,920 | $331,565 | $72,171 | $259,394 |
| 2024 | $1,920 | $292,664 | $0 | $0 |
| 2023 | $4,826 | $266,058 | $0 | $0 |
| 2022 | $5,297 | $241,871 | $0 | $0 |
| 2021 | $5,018 | $219,880 | $36,790 | $183,090 |
| 2020 | $4,873 | $207,760 | $34,440 | $173,320 |
| 2019 | $5,001 | $206,190 | $34,440 | $171,750 |
| 2018 | $4,742 | $183,420 | $16,420 | $167,000 |
| 2017 | $4,461 | $171,890 | $16,420 | $155,470 |
| 2016 | $3,972 | $165,260 | $16,420 | $148,840 |
| 2015 | -- | $144,580 | $14,080 | $130,500 |
| 2014 | -- | $139,730 | $14,080 | $125,650 |
Source: Public Records
Map
Nearby Homes
- 304 Cyndilu Ln
- 114 Sondra Lin Blvd
- 903 N Miller St
- 307 E Vernon St
- 606 W Mulberry St
- 802 N Church St
- 700 N Church St
- 407 N Lane St
- 602 N Cates St
- 4112 U S 380
- 50+/- acres U S 380
- 1404 Shady Ln
- 2811 N Trinity St
- 1 S Martin Extension
- 1408 N Business 287
- TBD Farm To Market 51
- 0 N Hwy 287 Unit 25379920
- 305 E Shoemaker St
- 401 S Holman St
- 506 E Main St
- 207 Ridge View Ct
- 301 Ridge View Ct
- 200 Greathouse Village
- 210 Greathouse Village
- 220 Greathouse Village
- 205 Ridge View Ct
- 180 Greathouse Village
- 230 Greathouse Village
- 170 Greathouse Village
- 208 Ridge View Ct
- 240 Greathouse Village
- 160 Greathouse Village
- 300 Ridge View Ct
- 250 Greathouse Village
- 150 Greathouse Village
- 203 Ridge View Ct
- 302 Ridge View Ct
- 305 Ridge View Ct
- 260 Greathouse Village
- 140 Greathouse Village