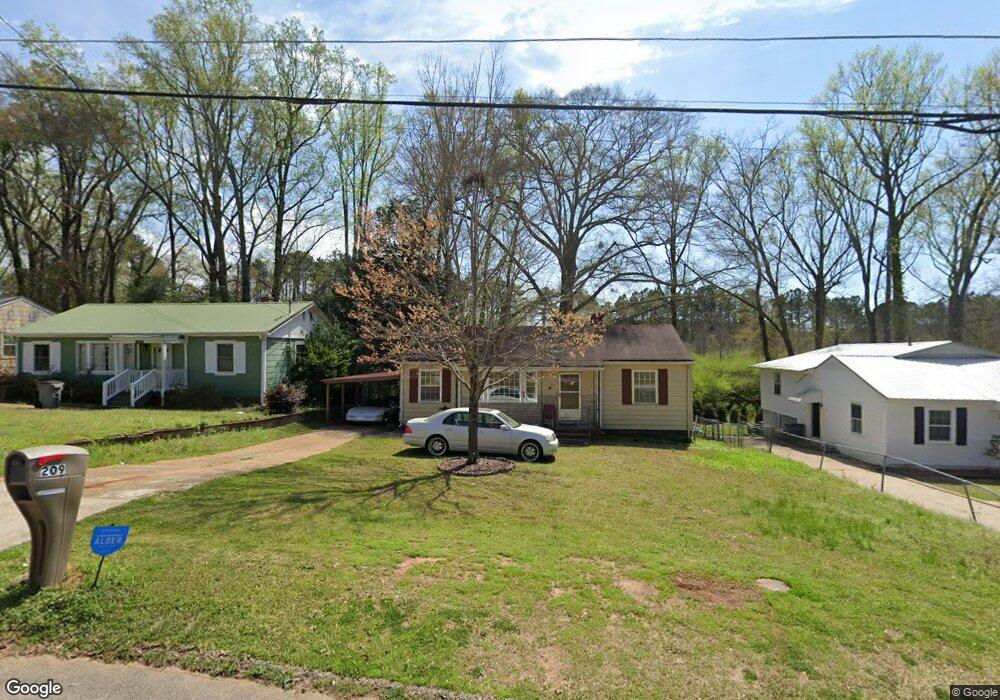
209 Rutland Cir Lagrange, GA 30241
Estimated Value: $117,000 - $161,000
3
Beds
1
Bath
1,025
Sq Ft
$129/Sq Ft
Est. Value
About This Home
This home is located at 209 Rutland Cir, Lagrange, GA 30241 and is currently estimated at $132,386, approximately $129 per square foot. 209 Rutland Cir is a home located in Troup County with nearby schools including Franklin Forest Elementary School, Hollis Hand Elementary School, and Ethel W. Kight Elementary School.
Ownership History
Date
Name
Owned For
Owner Type
Purchase Details
Closed on
Jul 29, 2019
Sold by
Houston Donald
Bought by
Fitzpatrick Sid
Current Estimated Value
Purchase Details
Closed on
Sep 17, 2014
Sold by
Hicks Patrick Mills
Bought by
Houston Donald
Home Financials for this Owner
Home Financials are based on the most recent Mortgage that was taken out on this home.
Original Mortgage
$30,000
Interest Rate
4.15%
Mortgage Type
New Conventional
Purchase Details
Closed on
Aug 11, 1981
Sold by
Harris Ronald H and Harris Lynn D
Bought by
Hicks Patrick
Purchase Details
Closed on
Sep 19, 1978
Sold by
Wilkerson Donald Wayne
Bought by
Harris Ronald H and Harris Lynn D
Purchase Details
Closed on
Feb 1, 1966
Sold by
Hannah Marvin M and Hannah Edythe C
Bought by
Wilkerson Donald Wayne
Create a Home Valuation Report for This Property
The Home Valuation Report is an in-depth analysis detailing your home's value as well as a comparison with similar homes in the area
Home Values in the Area
Average Home Value in this Area
Purchase History
| Date | Buyer | Sale Price | Title Company |
|---|---|---|---|
| Fitzpatrick Sid | $60,000 | -- | |
| Houston Donald | $30,000 | -- | |
| Hicks Patrick | $18,000 | -- | |
| Harris Ronald H | $27,500 | -- | |
| Wilkerson Donald Wayne | $9,900 | -- |
Source: Public Records
Mortgage History
| Date | Status | Borrower | Loan Amount |
|---|---|---|---|
| Previous Owner | Houston Donald | $30,000 |
Source: Public Records
Tax History Compared to Growth
Tax History
| Year | Tax Paid | Tax Assessment Tax Assessment Total Assessment is a certain percentage of the fair market value that is determined by local assessors to be the total taxable value of land and additions on the property. | Land | Improvement |
|---|---|---|---|---|
| 2024 | $232 | $33,320 | $8,000 | $25,320 |
| 2023 | $231 | $33,200 | $6,440 | $26,760 |
| 2022 | $231 | $31,800 | $6,440 | $25,360 |
| 2021 | $162 | $24,240 | $6,440 | $17,800 |
| 2020 | $724 | $24,240 | $6,440 | $17,800 |
| 2019 | $572 | $18,960 | $5,200 | $13,760 |
| 2018 | $572 | $18,960 | $5,200 | $13,760 |
| 2017 | $572 | $18,960 | $5,200 | $13,760 |
| 2016 | $558 | $18,487 | $5,200 | $13,287 |
| 2015 | $559 | $18,487 | $5,200 | $13,287 |
| 2014 | $478 | $17,788 | $5,200 | $12,588 |
| 2013 | -- | $18,866 | $5,200 | $13,666 |
Source: Public Records
Map
Nearby Homes
- 210 Hearthstone Dr
- 618 S Harlem Cir
- 616 S Harlem Cir
- 130 Clara Jean Ct
- 706 N Harlem Cir
- 608 S Harlem Cir
- 5 Curran Ave
- 121 Ct
- 606 S Harlem Cir
- 600 S Harlem Cir
- 131 Foch St
- 305 Lenox Cir
- 226 Lenox Cir
- 105 Lenox Cir
- 101 Lenox Cir
- 0 N Barnard Ave
- 121 de Groat St
- 906 Georgia Ave
- 902 Georgia Ave
- 621 Arthur St
- 207 Rutland Cir
- 205 Rutland Cir
- 213 Rutland Cir
- 203 Rutland Cir
- 215 Rutland Cir
- 206 Rutland Cir
- 204 Rutland Cir
- 204 Rutland Cir Unit 19
- 208 Rutland Cir
- 201 Rutland Cir
- 202 Rutland Cir
- 210 Rutland Cir
- 200 Rutland Cir
- 217 Rutland Cir
- 107 Rutland Cir
- 238 Rutland Cir
- 214 Rutland Cir
- 105 Rutland Cir
- 228 Rutland Cir
- 236 Rutland Cir