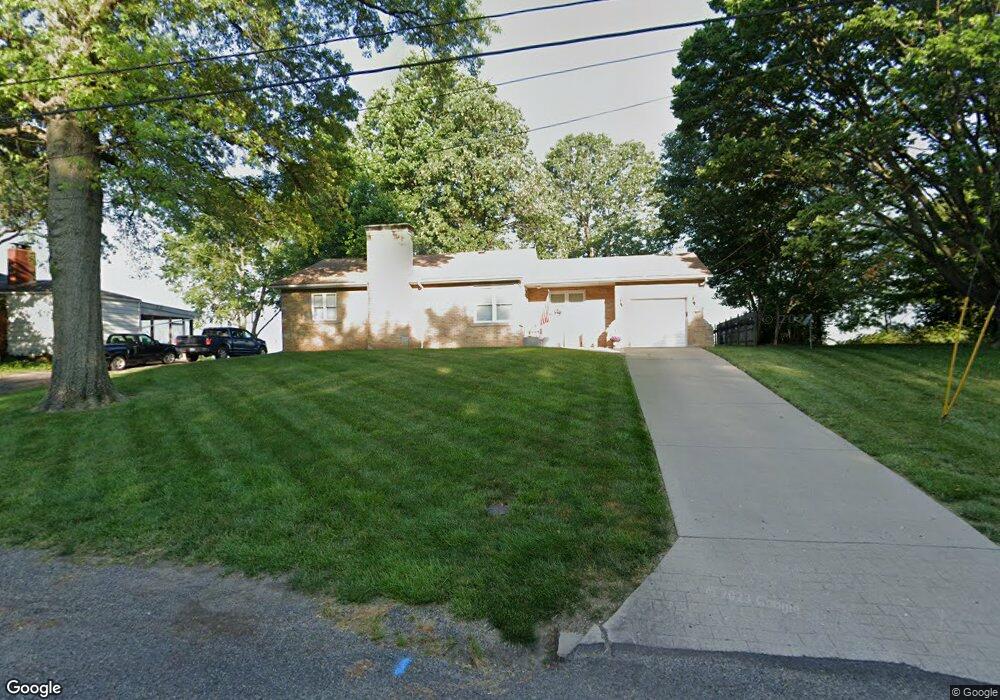
209 S Crown Dr Collinsville, IL 62234
Estimated Value: $144,220 - $176,000
--
Bed
--
Bath
1,242
Sq Ft
$128/Sq Ft
Est. Value
About This Home
This home is located at 209 S Crown Dr, Collinsville, IL 62234 and is currently estimated at $159,555, approximately $128 per square foot. 209 S Crown Dr is a home located in St. Clair County with nearby schools including Twin Echo Elementary School, Dorris Intermediate School, and Collinsville Middle School.
Ownership History
Date
Name
Owned For
Owner Type
Purchase Details
Closed on
Sep 16, 2022
Sold by
Krawczyk Laverne
Bought by
Mowe Michael J and Mowe Beverly R
Current Estimated Value
Home Financials for this Owner
Home Financials are based on the most recent Mortgage that was taken out on this home.
Original Mortgage
$16,000
Outstanding Balance
$15,376
Interest Rate
6.02%
Mortgage Type
New Conventional
Estimated Equity
$144,179
Purchase Details
Closed on
Sep 20, 2021
Sold by
Brown Darrell G
Bought by
St Clair County and Trust No 03 05 0 105 049
Purchase Details
Closed on
Jun 19, 2015
Sold by
Mowe Michael J and Mowe Beverly R
Bought by
Mowe Michael J and Mowe Beverly R
Home Financials for this Owner
Home Financials are based on the most recent Mortgage that was taken out on this home.
Original Mortgage
$30,000
Interest Rate
3.25%
Mortgage Type
Credit Line Revolving
Purchase Details
Closed on
Aug 24, 2006
Sold by
Krawczyk Laverne
Bought by
Mowe Michael
Create a Home Valuation Report for This Property
The Home Valuation Report is an in-depth analysis detailing your home's value as well as a comparison with similar homes in the area
Home Values in the Area
Average Home Value in this Area
Purchase History
| Date | Buyer | Sale Price | Title Company |
|---|---|---|---|
| Mowe Michael J | -- | Town & Country Title | |
| St Clair County | -- | None Available | |
| Mowe Michael J | -- | Abstracts & Titles Inc | |
| Mowe Michael | -- | None Available |
Source: Public Records
Mortgage History
| Date | Status | Borrower | Loan Amount |
|---|---|---|---|
| Open | Mowe Michael J | $16,000 | |
| Previous Owner | Mowe Michael J | $30,000 |
Source: Public Records
Tax History Compared to Growth
Tax History
| Year | Tax Paid | Tax Assessment Tax Assessment Total Assessment is a certain percentage of the fair market value that is determined by local assessors to be the total taxable value of land and additions on the property. | Land | Improvement |
|---|---|---|---|---|
| 2024 | $1,649 | $46,984 | $4,512 | $42,472 |
| 2023 | $1,721 | $41,571 | $3,992 | $37,579 |
| 2022 | $1,713 | $39,627 | $3,913 | $35,714 |
| 2021 | $1,776 | $37,611 | $3,714 | $33,897 |
| 2020 | $1,781 | $35,627 | $3,518 | $32,109 |
| 2019 | $1,801 | $35,627 | $3,518 | $32,109 |
| 2018 | $1,833 | $35,938 | $3,760 | $32,178 |
| 2017 | $1,824 | $34,480 | $3,608 | $30,872 |
| 2016 | $1,851 | $33,702 | $3,527 | $30,175 |
| 2014 | $204 | $33,959 | $3,646 | $30,313 |
| 2013 | -- | $34,585 | $3,713 | $30,872 |
Source: Public Records
Map
Nearby Homes
- 408 Hillside Dr
- 101 Osage Dr
- 9 Grandview Dr
- 717 Greenwood Place
- 625 Greenwood Place
- 89 Fox Run Rd
- 11 Davis Place
- 151 Helen Place
- 202 Keeneland Ct
- 208 Coral Dr
- 8085 Villa Valley Ln
- 24 W Reynolds St
- 710 Saint Louis Rd
- 8080 Villa Valley Ln
- 804 Carl St
- 116 Moffett Ave
- 114 Moffett Ave Unit 116
- 1109 Saint Clair Ave
- Alexandria Plan at Tanglewood
- Hannah Plan at Tanglewood