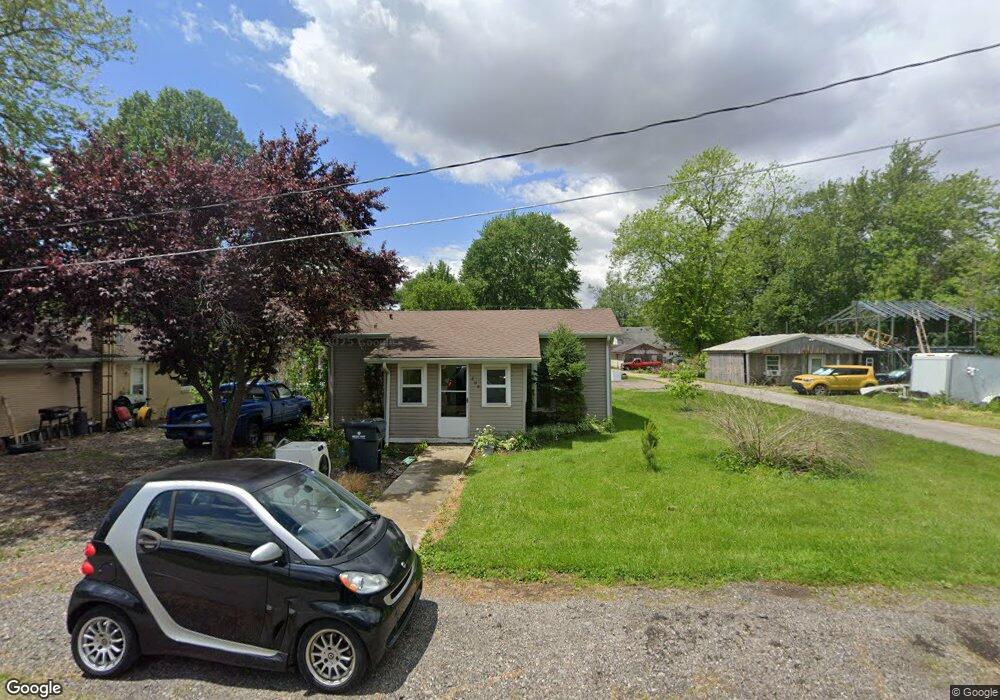
209 S Hinshaw St Unit Kennard Kennard, IN 47351
Estimated Value: $103,000 - $149,000
2
Beds
1
Bath
1,032
Sq Ft
$116/Sq Ft
Est. Value
About This Home
This home is located at 209 S Hinshaw St Unit Kennard, Kennard, IN 47351 and is currently estimated at $119,915, approximately $116 per square foot. 209 S Hinshaw St Unit Kennard is a home located in Henry County with nearby schools including Knightstown Elementary School, Knightstown Intermediate School, and Knightstown High School.
Ownership History
Date
Name
Owned For
Owner Type
Purchase Details
Closed on
Jun 4, 2020
Sold by
Phipps Susan N and Shelton Susan N
Bought by
Ohlder Caleb
Current Estimated Value
Purchase Details
Closed on
Sep 21, 2012
Sold by
Fannie Mae
Bought by
Phipps Susan N
Purchase Details
Closed on
Jun 25, 2012
Purchase Details
Closed on
Jun 7, 2012
Sold by
Perriman Jacob S and Perriman Jacob
Bought by
Wells Fargo Bank N A
Purchase Details
Closed on
Jul 25, 2005
Sold by
Allee John and Allee Brenda
Bought by
Perriman Jacob S
Home Financials for this Owner
Home Financials are based on the most recent Mortgage that was taken out on this home.
Original Mortgage
$53,550
Interest Rate
8.35%
Mortgage Type
Adjustable Rate Mortgage/ARM
Create a Home Valuation Report for This Property
The Home Valuation Report is an in-depth analysis detailing your home's value as well as a comparison with similar homes in the area
Home Values in the Area
Average Home Value in this Area
Purchase History
| Date | Buyer | Sale Price | Title Company |
|---|---|---|---|
| Ohlder Caleb | -- | None Available | |
| Phipps Susan N | -- | None Available | |
| -- | $9,300 | -- | |
| Federal National Mortgage Association | -- | None Available | |
| Wells Fargo Bank N A | $9,265 | None Available | |
| Perriman Jacob S | -- | Investors Titlecorp |
Source: Public Records
Mortgage History
| Date | Status | Borrower | Loan Amount |
|---|---|---|---|
| Previous Owner | Perriman Jacob S | $53,550 |
Source: Public Records
Tax History Compared to Growth
Tax History
| Year | Tax Paid | Tax Assessment Tax Assessment Total Assessment is a certain percentage of the fair market value that is determined by local assessors to be the total taxable value of land and additions on the property. | Land | Improvement |
|---|---|---|---|---|
| 2024 | $228 | $36,500 | $10,300 | $26,200 |
| 2023 | $287 | $37,900 | $10,300 | $27,600 |
| 2022 | $316 | $37,200 | $9,400 | $27,800 |
| 2021 | $291 | $32,800 | $9,400 | $23,400 |
| 2020 | $321 | $33,100 | $9,400 | $23,700 |
| 2019 | $782 | $33,100 | $9,400 | $23,700 |
| 2018 | $788 | $33,300 | $9,400 | $23,900 |
| 2017 | $689 | $30,000 | $9,400 | $20,600 |
| 2016 | $675 | $29,700 | $9,400 | $20,300 |
| 2014 | $638 | $29,000 | $9,400 | $19,600 |
| 2013 | $638 | $28,100 | $9,400 | $18,700 |
Source: Public Records
Map
Nearby Homes
- 202 W Martindale St
- 1078 Lake Dr
- 1122 Lake Dr
- 1373 S State Road 234 Rd Unit Kennard
- 1373 S State Road 234 Rd
- 0 Lake Dr
- 1105 Lake Dr
- 1087 Lake Ct
- 1035 Lake Ct
- 10723 State Road 234
- 0000 W County Road 350 S
- 7898 W County Road 350 S
- 314 Main St
- 0 County Road 1200 E
- 1200 North St
- 126 Illinois St
- 0 N 1200 E Unit LotWP001
- 0 N Railroad St Unit MBR21989219
- 0 Pennsylvania St Unit MBR22027178
- 0 Pennsylvania St Unit MBR22047696
- 209 S Hinshaw St
- 209 Hinshaw Unit Kennard
- 102 E Martindale St
- 207 Hinshaw St
- 205 S Hinshaw St
- 205 S Hinshaw St Unit 5
- 208 S Hinshaw St
- 105 E Martindale St
- 103 E Martindale St
- 203 S Hinshaw St
- 204 S Hinshaw St
- 204 S Main St
- 208 S Main St
- 210 S Main St
- 206 S Main St
- 321 S Main St
- 305 S Main St
- 101 W County Road 200 S
- 101 E County Road 200 S
- 101 E Cty Rd 200 St S