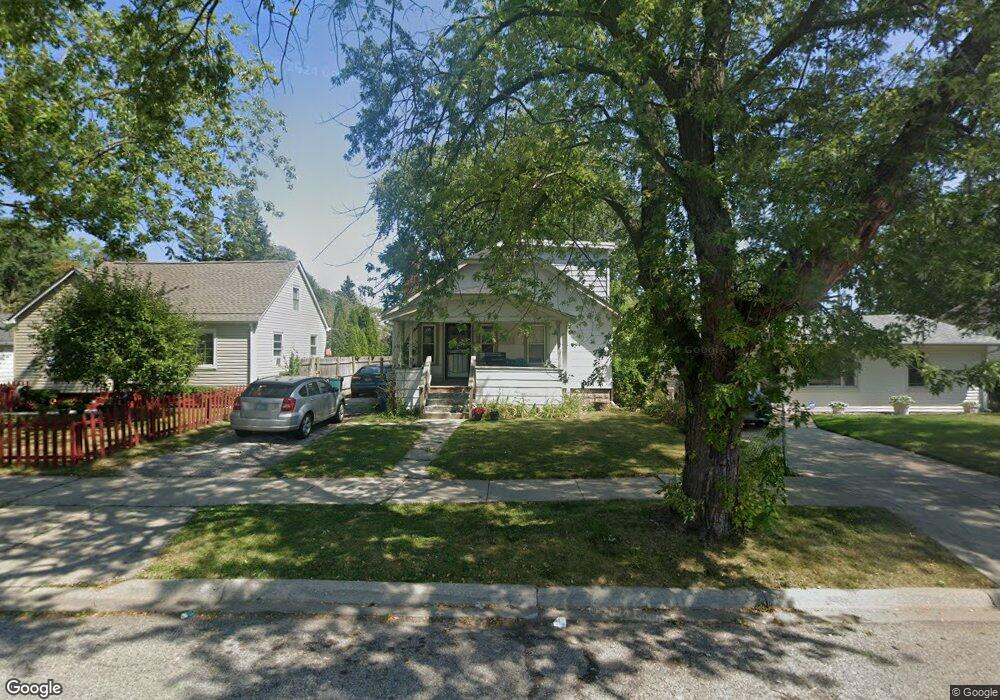
209 S Martin Ave Waukegan, IL 60085
West Waukegan NeighborhoodEstimated Value: $234,000 - $280,000
4
Beds
2
Baths
1,794
Sq Ft
$142/Sq Ft
Est. Value
About This Home
This home is located at 209 S Martin Ave, Waukegan, IL 60085 and is currently estimated at $255,128, approximately $142 per square foot. 209 S Martin Ave is a home located in Lake County with nearby schools including Washington Elementary School, Robert E. Abbott Middle School, and Waukegan High School.
Ownership History
Date
Name
Owned For
Owner Type
Purchase Details
Closed on
Apr 4, 2014
Sold by
Weatherspoon Brittaney
Bought by
Charleston Laurena
Current Estimated Value
Purchase Details
Closed on
May 16, 2013
Sold by
Charleston Lurena
Bought by
Weatherspoon Brittaney
Purchase Details
Closed on
Jun 4, 2007
Sold by
Carr Lurena Weatherspoon and Charleston Lurena
Bought by
Charleston Lurena
Purchase Details
Closed on
Sep 6, 1998
Sold by
Charlton Wilson and Kilpatrick Gertrude Kimberly
Bought by
Carr Lurena Weatherspoon
Purchase Details
Closed on
Jun 13, 1997
Sold by
Wilson Carr Lurena Weatherspoon and Wilson Charlton
Bought by
Wilson Kilpatrick Gertrude Kimberly and Wilson Charlton
Purchase Details
Closed on
Dec 27, 1994
Sold by
Carr Lurena Weatherspoon
Bought by
Wilson Carr Lurena Weatherspoon and Wilson Charlton
Purchase Details
Closed on
Oct 12, 1994
Sold by
Carr Lurena and Charleston Joe E
Bought by
Carr Lurena
Purchase Details
Closed on
Feb 15, 1994
Sold by
Carr Lurena Weatherspoon
Bought by
Carr Lurena Weatherspoon and Charleston Joe Edmond
Create a Home Valuation Report for This Property
The Home Valuation Report is an in-depth analysis detailing your home's value as well as a comparison with similar homes in the area
Home Values in the Area
Average Home Value in this Area
Purchase History
| Date | Buyer | Sale Price | Title Company |
|---|---|---|---|
| Charleston Laurena | -- | None Available | |
| Weatherspoon Brittaney | -- | None Available | |
| Charleston Lurena | -- | None Available | |
| Carr Lurena Weatherspoon | -- | -- | |
| Carr Lurena W | -- | -- | |
| Wilson Kilpatrick Gertrude Kimberly | -- | -- | |
| Wilson Carr Lurena Weatherspoon | -- | -- | |
| Carr Lurena | -- | -- | |
| Carr Lurena Weatherspoon | -- | -- |
Source: Public Records
Tax History Compared to Growth
Tax History
| Year | Tax Paid | Tax Assessment Tax Assessment Total Assessment is a certain percentage of the fair market value that is determined by local assessors to be the total taxable value of land and additions on the property. | Land | Improvement |
|---|---|---|---|---|
| 2024 | $1,921 | $65,451 | $7,632 | $57,819 |
| 2023 | $3,920 | $58,547 | $6,827 | $51,720 |
| 2022 | $3,920 | $53,094 | $6,060 | $47,034 |
| 2021 | $2,645 | $44,355 | $5,212 | $39,143 |
| 2020 | $3,777 | $41,322 | $4,856 | $36,466 |
| 2019 | $3,731 | $37,865 | $4,450 | $33,415 |
| 2018 | $2,910 | $31,017 | $6,298 | $24,719 |
| 2017 | $2,765 | $27,441 | $5,572 | $21,869 |
| 2016 | $2,449 | $23,845 | $4,842 | $19,003 |
| 2015 | $2,254 | $21,342 | $4,334 | $17,008 |
| 2014 | $4,059 | $31,376 | $4,370 | $27,006 |
| 2012 | $5,324 | $33,992 | $4,734 | $29,258 |
Source: Public Records
Map
Nearby Homes
- 49 S Lewis Ave
- 12601 W Atlantic Ave
- 2116 & 2101 Williamsburg Dr
- 1521 Catalpa Ave
- 132 Dorchester Ct
- 2726 W Hidden Glen Dr
- 1416 Hamilton Ct
- 24 Washington Terrace
- 446 S Jackson St
- 0 Brookside Ave
- 23 N Jackson St
- 102 Baldwin Ave
- 2115 Lydia St
- 819 S Fulton Ave
- 304 Powell Ave
- 408 Besley Place
- 305 Besley Place
- 615 Tiffany Dr
- 613 Clarke Ave
- 910 Cummings Ave
- 205 S Martin Ave
- 213 S Martin Ave
- 219 S Martin Ave
- 2031 Melrose Ave
- 2022 Cooke Ct
- 221 S Martin Ave
- 2017 Melrose Ave
- 2018 Cooke Ct
- 210 S Martin Ave
- 206 S Martin Ave
- 2016 Cooke Ct
- 216 S Martin Ave
- 151 S Martin Ave
- 2105 Melrose Ave
- 2013 Melrose Ave
- 222 S Martin Ave
- 2029 Cooke Ct
- 2014 Cooke Ct
- 147 S Martin Ave
- 224 S Martin Ave