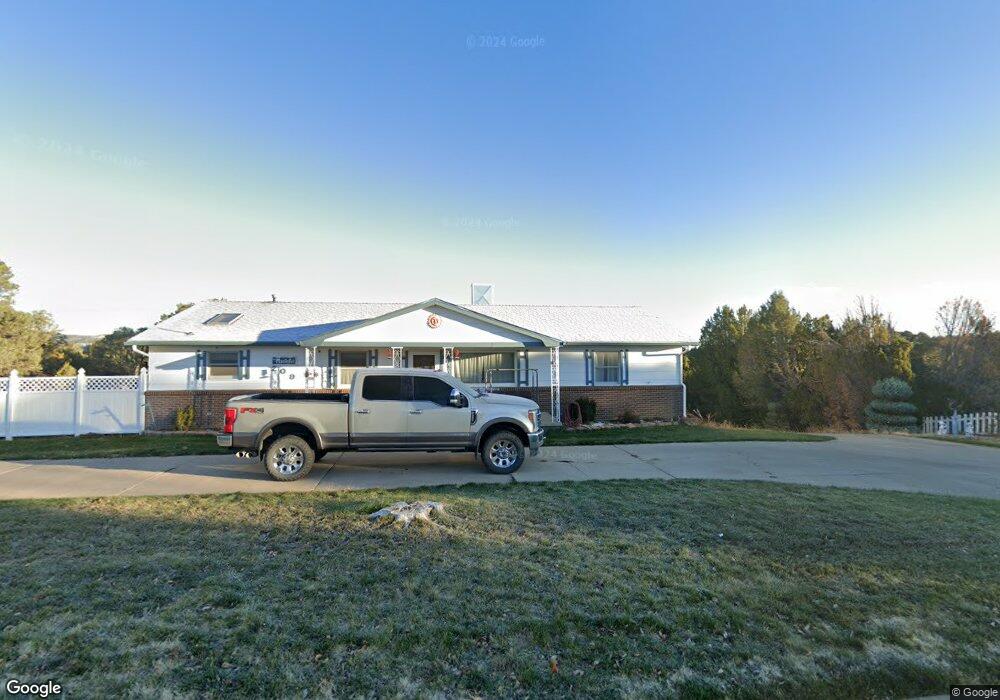
209 Saddle Rd Trinidad, CO 81082
Estimated Value: $278,000 - $367,000
3
Beds
2
Baths
2,464
Sq Ft
$132/Sq Ft
Est. Value
About This Home
This home is located at 209 Saddle Rd, Trinidad, CO 81082 and is currently estimated at $325,107, approximately $131 per square foot. 209 Saddle Rd is a home with nearby schools including Fisher's Peak Elementary School, Trinidad Middle School, and Trinidad High School.
Ownership History
Date
Name
Owned For
Owner Type
Purchase Details
Closed on
Jan 18, 2020
Sold by
Zupanic Antoinette H and Mantelli Robert F
Bought by
Mantelli Robert F and Mantelli Louis M
Current Estimated Value
Home Financials for this Owner
Home Financials are based on the most recent Mortgage that was taken out on this home.
Original Mortgage
$180,000
Outstanding Balance
$159,434
Interest Rate
3.73%
Mortgage Type
New Conventional
Estimated Equity
$165,673
Purchase Details
Closed on
Oct 23, 2019
Sold by
Zupanic Antoinette H
Bought by
Zupanic Antoinette H and Mantelli Robert F
Purchase Details
Closed on
Feb 15, 2018
Sold by
Mantelli Roberta
Bought by
Mantelli Louis M and Zupancic Antoinette H
Purchase Details
Closed on
Dec 15, 2015
Sold by
Veltri Marlene and Mantelli Robert
Bought by
Mantelli Robert and Mantelli Roberta J
Purchase Details
Closed on
Feb 23, 2010
Sold by
Mantelli Louis M
Bought by
Zupanic Antoinette H
Create a Home Valuation Report for This Property
The Home Valuation Report is an in-depth analysis detailing your home's value as well as a comparison with similar homes in the area
Home Values in the Area
Average Home Value in this Area
Purchase History
| Date | Buyer | Sale Price | Title Company |
|---|---|---|---|
| Mantelli Robert F | -- | None Available | |
| Zupanic Antoinette H | -- | -- | |
| Mantelli Louis M | -- | -- | |
| Mantelli Robert | -- | None Available | |
| Zupanic Antoinette H | -- | None Available |
Source: Public Records
Mortgage History
| Date | Status | Borrower | Loan Amount |
|---|---|---|---|
| Open | Mantelli Robert F | $180,000 |
Source: Public Records
Tax History Compared to Growth
Tax History
| Year | Tax Paid | Tax Assessment Tax Assessment Total Assessment is a certain percentage of the fair market value that is determined by local assessors to be the total taxable value of land and additions on the property. | Land | Improvement |
|---|---|---|---|---|
| 2025 | $437 | $12,960 | $390 | $12,570 |
| 2024 | $437 | $11,830 | $390 | $11,440 |
| 2023 | $437 | $8,150 | $270 | $7,880 |
| 2022 | $538 | $10,410 | $400 | $10,010 |
| 2021 | $547 | $10,710 | $410 | $10,300 |
| 2020 | $276 | $10,970 | $410 | $10,560 |
| 2019 | $5 | $10,970 | $410 | $10,560 |
| 2018 | $260 | $10,140 | $420 | $9,720 |
| 2017 | $252 | $10,140 | $0 | $0 |
| 2015 | $272 | $11,209 | $0 | $0 |
| 2013 | $281 | $11,209 | $461 | $10,748 |
Source: Public Records
Map
Nearby Homes
- 107 Radio Dr
- 232 Saddle Rd
- 235 Nona Ave
- TBD Santa fe Trail
- TBD County Rd 93 9
- 203 Farasita St
- nya Moores Canyon Rd
- 2655 Aguilar Dr
- 2644 Barela St
- 2655 Delagua St
- 2664 Espinoza St
- 11510
- 406 Riata Dr
- 704 W Jefferson St
- TBD W Jefferson St
- 0 W Jefferson St
- 728 W Adams St
- 1013 Grant Ave
- 720 W Washington Ave
- 1009 Grant Ave