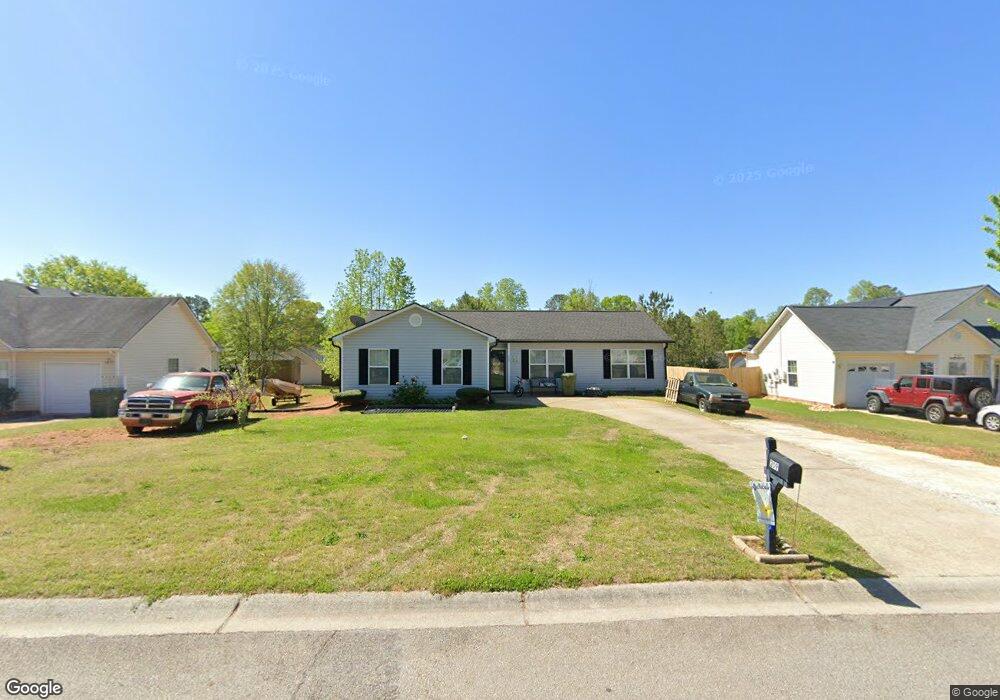
209 Sequoia Pointe Carrollton, GA 30117
Estimated Value: $227,000 - $251,000
3
Beds
2
Baths
1,312
Sq Ft
$181/Sq Ft
Est. Value
About This Home
This home is located at 209 Sequoia Pointe, Carrollton, GA 30117 and is currently estimated at $237,203, approximately $180 per square foot. 209 Sequoia Pointe is a home located in Carroll County with nearby schools including Carrollton Elementary School, Carrollton Upper Elementary School, and Carrollton Middle School.
Ownership History
Date
Name
Owned For
Owner Type
Purchase Details
Closed on
Jun 23, 2010
Sold by
Mayor
Bought by
Henderson Dominica
Current Estimated Value
Home Financials for this Owner
Home Financials are based on the most recent Mortgage that was taken out on this home.
Original Mortgage
$60,687
Outstanding Balance
$41,715
Interest Rate
5.5%
Mortgage Type
FHA
Estimated Equity
$195,488
Purchase Details
Closed on
Jun 14, 2010
Sold by
Mayor
Bought by
Henderson Dominica
Home Financials for this Owner
Home Financials are based on the most recent Mortgage that was taken out on this home.
Original Mortgage
$60,687
Outstanding Balance
$41,715
Interest Rate
5.5%
Mortgage Type
FHA
Estimated Equity
$195,488
Purchase Details
Closed on
Feb 23, 2010
Sold by
Ti Residential Lending Llc
Bought by
Mayor
Create a Home Valuation Report for This Property
The Home Valuation Report is an in-depth analysis detailing your home's value as well as a comparison with similar homes in the area
Home Values in the Area
Average Home Value in this Area
Purchase History
| Date | Buyer | Sale Price | Title Company |
|---|---|---|---|
| Henderson Dominica | $66,255 | -- | |
| Henderson Dominica | $66,255 | -- | |
| Mayor | $62,500 | -- |
Source: Public Records
Mortgage History
| Date | Status | Borrower | Loan Amount |
|---|---|---|---|
| Open | Henderson Dominica | $60,687 | |
| Closed | Henderson Dominica | $6,900 | |
| Closed | Mayor | $60,687 |
Source: Public Records
Tax History Compared to Growth
Tax History
| Year | Tax Paid | Tax Assessment Tax Assessment Total Assessment is a certain percentage of the fair market value that is determined by local assessors to be the total taxable value of land and additions on the property. | Land | Improvement |
|---|---|---|---|---|
| 2024 | $2,247 | $82,236 | $6,000 | $76,236 |
| 2023 | $2,247 | $75,334 | $6,000 | $69,334 |
| 2022 | $1,800 | $61,648 | $6,000 | $55,648 |
| 2021 | $1,507 | $51,624 | $4,000 | $47,624 |
| 2020 | $1,361 | $46,586 | $4,000 | $42,586 |
| 2019 | $1,253 | $42,488 | $4,000 | $38,488 |
| 2018 | $1,097 | $36,668 | $4,000 | $32,668 |
| 2017 | $1,103 | $36,668 | $4,000 | $32,668 |
| 2016 | $1,056 | $34,909 | $2,241 | $32,668 |
| 2015 | $760 | $24,607 | $4,000 | $20,607 |
| 2014 | $763 | $24,607 | $4,000 | $20,607 |
Source: Public Records
Map
Nearby Homes
- 0 Henson Cir Unit 10584639
- 0 Henson Cir Unit 7632920
- 114 Kyle Way
- 219 Candlewood Dr
- 345 Henson Cir
- 70 Henson Cir
- 85 Mary Ln
- 125 Springwood Dr
- 300 Georgia 113
- 0 Center Point Rd Unit TR 3 10274074
- 0 Center Point Rd Unit 7361099
- 70 W Meadowcliff Cir
- 524 Old Bremen Rd
- 45 Buell Jones Rd
- 110 Sharp Dr
- 1015 Mote Rd
- 102 Buell Jones Rd
- 281 Northwinds Blvd
- 281 Northwinds Blvd Unit B3
- 281 Northwinds Blvd Unit D3
- 209 Sequoia Point
- 211 Sequoia Point
- 211 Sequoia Pointe
- 207 Sequoia Point
- 205 Sequoia Point
- 210 Teton Ave
- 212 Teton Ave
- 208 Teton Ave
- 213 Sequoia Point
- 213 Sequoia Pointe
- 208 Sequoia Point
- 210 Sequoia Point
- 206 Sequoia Pointe
- 222 Teton Ave
- 216 Teton Ave
- 203 Sequoia Pointe
- 212 Sequoia Point
- 206 Teton Ave
- 260 Teton Ave
- 204 Sequoia Point