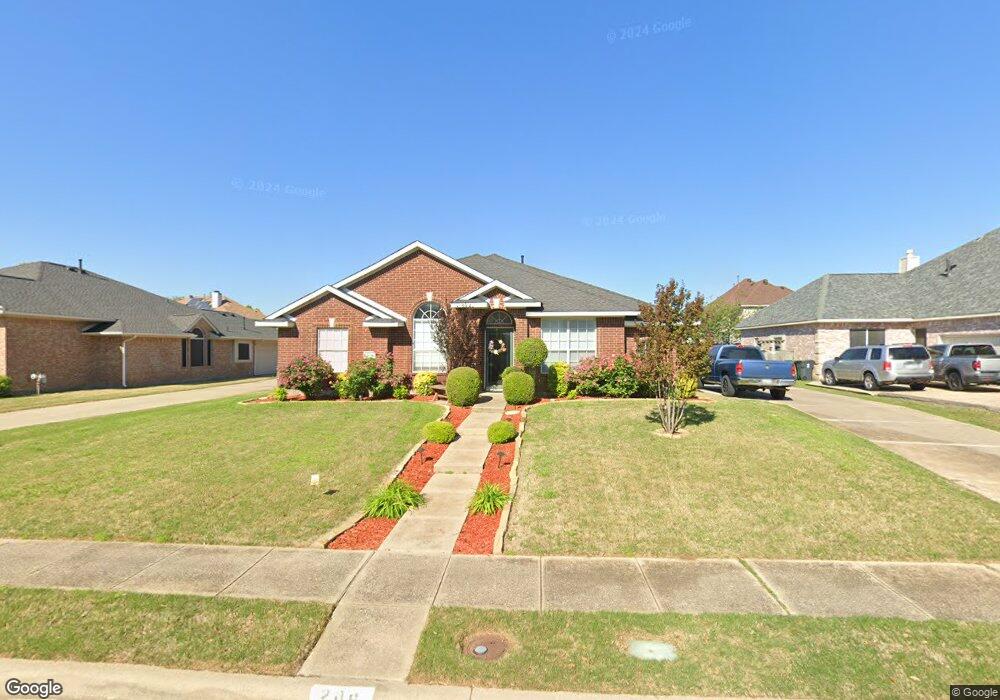
209 Shady Timbers Ln Murphy, TX 75094
Estimated Value: $419,000 - $458,000
3
Beds
2
Baths
1,933
Sq Ft
$227/Sq Ft
Est. Value
About This Home
This home is located at 209 Shady Timbers Ln, Murphy, TX 75094 and is currently estimated at $438,437, approximately $226 per square foot. 209 Shady Timbers Ln is a home located in Collin County with nearby schools including Miller Elementary School, Murphy Middle School, and C A Mcmillen High School.
Ownership History
Date
Name
Owned For
Owner Type
Purchase Details
Closed on
May 20, 2014
Sold by
Hunter Rebecca and Hunter Tandi Ranae
Bought by
Todd Jeffrey
Current Estimated Value
Home Financials for this Owner
Home Financials are based on the most recent Mortgage that was taken out on this home.
Original Mortgage
$165,418
Outstanding Balance
$126,303
Interest Rate
4.38%
Mortgage Type
New Conventional
Estimated Equity
$312,134
Purchase Details
Closed on
Mar 11, 2013
Sold by
Hunter Rebecca Lynn and Hunter Tandi Ranae
Bought by
Hunter Tandi Ranae
Purchase Details
Closed on
Aug 7, 1996
Sold by
Mercedes Homes Of Texas Inc
Bought by
Hunter Darvin and Hunter Rebecca
Home Financials for this Owner
Home Financials are based on the most recent Mortgage that was taken out on this home.
Original Mortgage
$120,000
Interest Rate
8.32%
Create a Home Valuation Report for This Property
The Home Valuation Report is an in-depth analysis detailing your home's value as well as a comparison with similar homes in the area
Home Values in the Area
Average Home Value in this Area
Purchase History
| Date | Buyer | Sale Price | Title Company |
|---|---|---|---|
| Todd Jeffrey | -- | None Available | |
| Hunter Tandi Ranae | -- | None Available | |
| Hunter Darvin | -- | -- |
Source: Public Records
Mortgage History
| Date | Status | Borrower | Loan Amount |
|---|---|---|---|
| Open | Todd Jeffrey | $165,418 | |
| Previous Owner | Hunter Darvin | $120,000 |
Source: Public Records
Tax History Compared to Growth
Tax History
| Year | Tax Paid | Tax Assessment Tax Assessment Total Assessment is a certain percentage of the fair market value that is determined by local assessors to be the total taxable value of land and additions on the property. | Land | Improvement |
|---|---|---|---|---|
| 2025 | $4,456 | $376,589 | $115,000 | $306,477 |
| 2024 | $4,456 | $342,354 | $115,000 | $310,672 |
| 2023 | $4,456 | $311,231 | $115,000 | $274,292 |
| 2022 | $5,541 | $282,937 | $100,000 | $241,802 |
| 2021 | $5,312 | $257,215 | $80,000 | $177,215 |
| 2020 | $5,293 | $253,413 | $70,000 | $183,413 |
| 2019 | $5,449 | $248,709 | $70,000 | $178,709 |
| 2018 | $5,435 | $245,804 | $70,000 | $177,429 |
| 2017 | $4,941 | $223,458 | $70,000 | $153,458 |
| 2016 | $4,582 | $215,404 | $60,000 | $155,404 |
| 2015 | $3,853 | $186,077 | $45,000 | $141,077 |
Source: Public Records
Map
Nearby Homes
- 202 Sweetgum Dr
- 237 Mimosa Dr
- 248 Mimosa Dr
- 113 Birch Blvd
- Pampa Farmhouse Plan at Crescent Hill
- 110 Birch Blvd
- 322 Willow Wood St
- 342 Willow Wood St
- 356 Willow Wood St
- 600 E Fm 544
- 524 Jasmine Dr
- 465 Kinney Dr
- LOT#2 S Maxwell Creek Rd
- 401 N Maxwell Creek Rd
- 114 Edgemere Ct
- Grand Whitehall Plan at Lakes at Legacy
- Grand Heritage Plan at Lakes at Legacy
- Alexandria II Plan at Lakes at Legacy
- Grand Tour Plan at Lakes at Legacy
- Tiffany II Plan at Lakes at Legacy
- 205 Shady Timbers Ln
- 213 Shady Timbers Ln
- 208 Hawthorne Dr
- 204 Hawthorne Dr
- 212 Hawthorne Dr
- 217 Shady Timbers Ln
- 301 Sycamore Dr
- 201 Shady Timbers Ln
- 216 Hawthorne Dr
- 300 Woodlake Dr
- 200 Hawthorne Dr
- 221 Shady Timbers Ln
- 305 Sycamore Dr
- 300 Sycamore Dr
- 220 Hawthorne Dr
- 304 Woodlake Dr
- 129 Meadow Creek Dr
- 213 Hawthorne Dr
- 225 Shady Timbers Ln
- 217 Hawthorne Dr