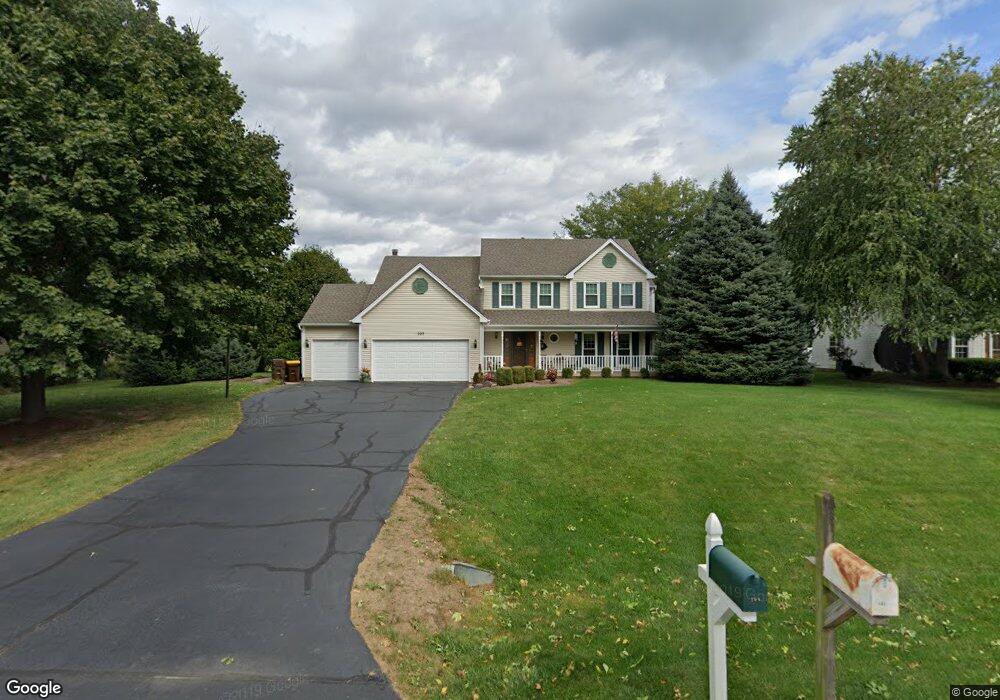
209 Shining Moon Path Gilberts, IL 60136
Estimated Value: $414,745 - $528,000
4
Beds
--
Bath
2,768
Sq Ft
$177/Sq Ft
Est. Value
About This Home
This home is located at 209 Shining Moon Path, Gilberts, IL 60136 and is currently estimated at $490,936, approximately $177 per square foot. 209 Shining Moon Path is a home located in Kane County with nearby schools including Gilberts Elementary School, Dundee Middle School, and Hampshire High School.
Ownership History
Date
Name
Owned For
Owner Type
Purchase Details
Closed on
Apr 9, 2010
Sold by
Harnish Roy E
Bought by
Harnish Roy E and Harnish Anna
Current Estimated Value
Create a Home Valuation Report for This Property
The Home Valuation Report is an in-depth analysis detailing your home's value as well as a comparison with similar homes in the area
Home Values in the Area
Average Home Value in this Area
Purchase History
| Date | Buyer | Sale Price | Title Company |
|---|---|---|---|
| Harnish Roy E | -- | None Available |
Source: Public Records
Tax History
| Year | Tax Paid | Tax Assessment Tax Assessment Total Assessment is a certain percentage of the fair market value that is determined by local assessors to be the total taxable value of land and additions on the property. | Land | Improvement |
|---|---|---|---|---|
| 2024 | $8,310 | $129,679 | $32,207 | $97,472 |
| 2023 | $7,859 | $116,681 | $28,979 | $87,702 |
| 2022 | $7,757 | $107,944 | $28,979 | $78,965 |
| 2021 | $7,495 | $101,921 | $27,362 | $74,559 |
| 2020 | $7,348 | $99,630 | $26,747 | $72,883 |
| 2019 | $7,119 | $94,579 | $25,391 | $69,188 |
| 2018 | $7,636 | $97,369 | $28,842 | $68,527 |
| 2017 | $7,289 | $91,084 | $26,980 | $64,104 |
| 2016 | $7,456 | $88,191 | $26,123 | $62,068 |
| 2015 | -- | $82,638 | $24,478 | $58,160 |
| 2014 | -- | $80,356 | $23,802 | $56,554 |
| 2013 | -- | $82,816 | $24,531 | $58,285 |
Source: Public Records
Map
Nearby Homes
- 568 Pamela St
- 0 Tyrrell Rd
- 523 Town Center Blvd
- 487 Town Center Blvd
- 110 Easton Dr
- 340 Town Center Blvd
- 339 Settlers Place
- 333 Settlers Place
- 140 Harvest Ln
- 325 Settlers Place
- 331 Settlers Place
- 337 Settlers Place
- 329 Settlers Place
- 243 Settlers Place
- 335 Settlers Place
- 151 Charleston Ln
- 616 Joy Ln Unit 15
- 102 Town Center Blvd Unit 2541
- 313 Settlers Place
- 311 Settlers Place
- 197 Shining Moon Path
- 219 Shining Moon Path
- 187 Shining Moon Path
- 210 Shining Moon Path
- 220 Shining Moon Path
- 571 Running Deer Ln
- 583 Running Deer Ln
- 186 Shining Moon Path
- 559 Running Deer Ln
- 584 Sleeping Bear Trail
- 570 Sleeping Bear Trail
- 560 Sleeping Bear Trail
- 545 Running Deer Ln
- 528 Running Deer Ln
- 525 Sleeping Bear Trail
- 544 Sleeping Bear Trail
- 535 Running Deer Ln
- 580 Kathleen St
- 562 Kathleen St
- 590 Kathleen St
Your Personal Tour Guide
Ask me questions while you tour the home.