Estimated Value: $354,000 - $377,000
3
Beds
2
Baths
1,778
Sq Ft
$205/Sq Ft
Est. Value
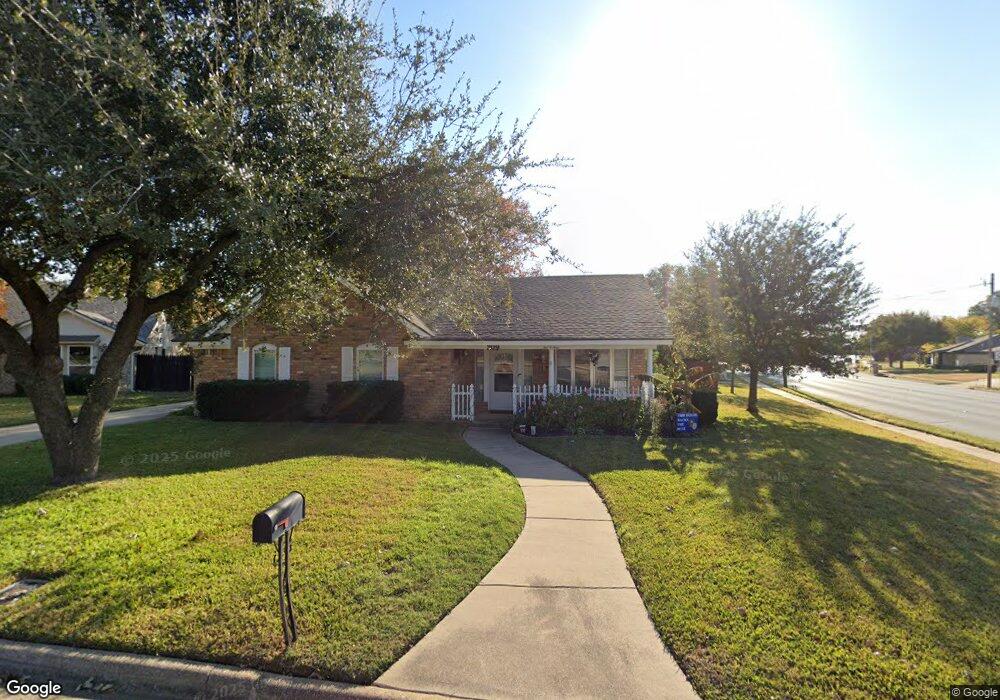
About This Home
This home is located at 209 Stratford Ct, Hurst, TX 76054 and is currently estimated at $363,651, approximately $204 per square foot. 209 Stratford Ct is a home located in Tarrant County with nearby schools including Bedford Heights Elementary School, Bedford Junior High School, and L.D. Bell High School.
Ownership History
Date
Name
Owned For
Owner Type
Purchase Details
Closed on
Dec 26, 2012
Sold by
Williams Teresita M and Hughes Teresita
Bought by
Hughes Teresita
Current Estimated Value
Home Financials for this Owner
Home Financials are based on the most recent Mortgage that was taken out on this home.
Original Mortgage
$93,200
Outstanding Balance
$10,249
Interest Rate
3.34%
Mortgage Type
New Conventional
Estimated Equity
$353,402
Purchase Details
Closed on
May 27, 2004
Sold by
Jerry & Mary Pospisil Trust
Bought by
Williams Fred W and Williams Teresita M
Home Financials for this Owner
Home Financials are based on the most recent Mortgage that was taken out on this home.
Original Mortgage
$117,900
Interest Rate
5.97%
Mortgage Type
Purchase Money Mortgage
Purchase Details
Closed on
Aug 8, 2003
Sold by
Pospisil Jerry A and Pospisil Mary E
Bought by
Pospisil Jerry Alvin and Pospisil Mary Elizabeth Krohn
Create a Home Valuation Report for This Property
The Home Valuation Report is an in-depth analysis detailing your home's value as well as a comparison with similar homes in the area
Home Values in the Area
Average Home Value in this Area
Purchase History
| Date | Buyer | Sale Price | Title Company |
|---|---|---|---|
| Hughes Teresita | -- | None Available | |
| Williams Fred W | -- | Metroplex Title Inc | |
| Pospisil Jerry Alvin | -- | -- |
Source: Public Records
Mortgage History
| Date | Status | Borrower | Loan Amount |
|---|---|---|---|
| Open | Hughes Teresita | $93,200 | |
| Closed | Williams Fred W | $117,900 |
Source: Public Records
Tax History
| Year | Tax Paid | Tax Assessment Tax Assessment Total Assessment is a certain percentage of the fair market value that is determined by local assessors to be the total taxable value of land and additions on the property. | Land | Improvement |
|---|---|---|---|---|
| 2025 | $2,073 | $336,861 | $75,000 | $261,861 |
| 2024 | $2,073 | $336,861 | $75,000 | $261,861 |
| 2023 | $6,253 | $338,262 | $55,000 | $283,262 |
| 2022 | $6,533 | $299,984 | $55,000 | $244,984 |
| 2021 | $6,221 | $269,656 | $55,000 | $214,656 |
| 2020 | $5,642 | $246,407 | $55,000 | $191,407 |
| 2019 | $5,217 | $256,808 | $55,000 | $201,808 |
| 2018 | $3,445 | $193,794 | $55,000 | $138,794 |
| 2017 | $4,458 | $197,006 | $18,000 | $179,006 |
| 2016 | $4,053 | $184,684 | $18,000 | $166,684 |
| 2015 | $3,367 | $145,600 | $18,000 | $127,600 |
| 2014 | $3,367 | $145,600 | $18,000 | $127,600 |
Source: Public Records
Map
Nearby Homes
- 317 Northglen Dr
- 404 Mountainview Dr
- 421 Cavender Ct
- 417 Sunnybrook Ct
- 2204 Mountainview Dr
- 200 Eagle Ct
- 3002 Carolyn Ct
- 3006 Carolyn Ct
- 412 Elisha Dr
- 440 W Louella Dr
- 617 Indian Trail
- 2244 Hurstview Dr
- 201 W Louella Dr
- 2157 Lookout Ct
- 305 Warbler Dr
- 2221 Farrington Ln
- 413 Blue Jay Ct
- 129 E Louella Dr
- 410 Carolyn Dr
- 413 Baker Dr
- 236 Carolyn Dr
- 213 Stratford Ct
- 232 Carolyn Dr
- 301 Stratford Dr
- 212 Stratford Ct
- 228 Carolyn Dr
- 300 Stratford Dr
- 2021 Norwood Dr
- 208 Stratford Ct
- 200 Stratford Ct
- 2025 Normandy Dr
- 2029 Normandy Dr
- 204 Stratford Ct
- 304 Stratford Dr
- 239 Carolyn Dr
- 2033 Normandy Dr
- 235 Carolyn Dr
- 2017 Norwood Dr
- 309 Stratford Dr
- 2037 Normandy Dr
Your Personal Tour Guide
Ask me questions while you tour the home.